Real time Meteorologica data and Weather Forecast
![]()
Real time Meteorologica
|
|
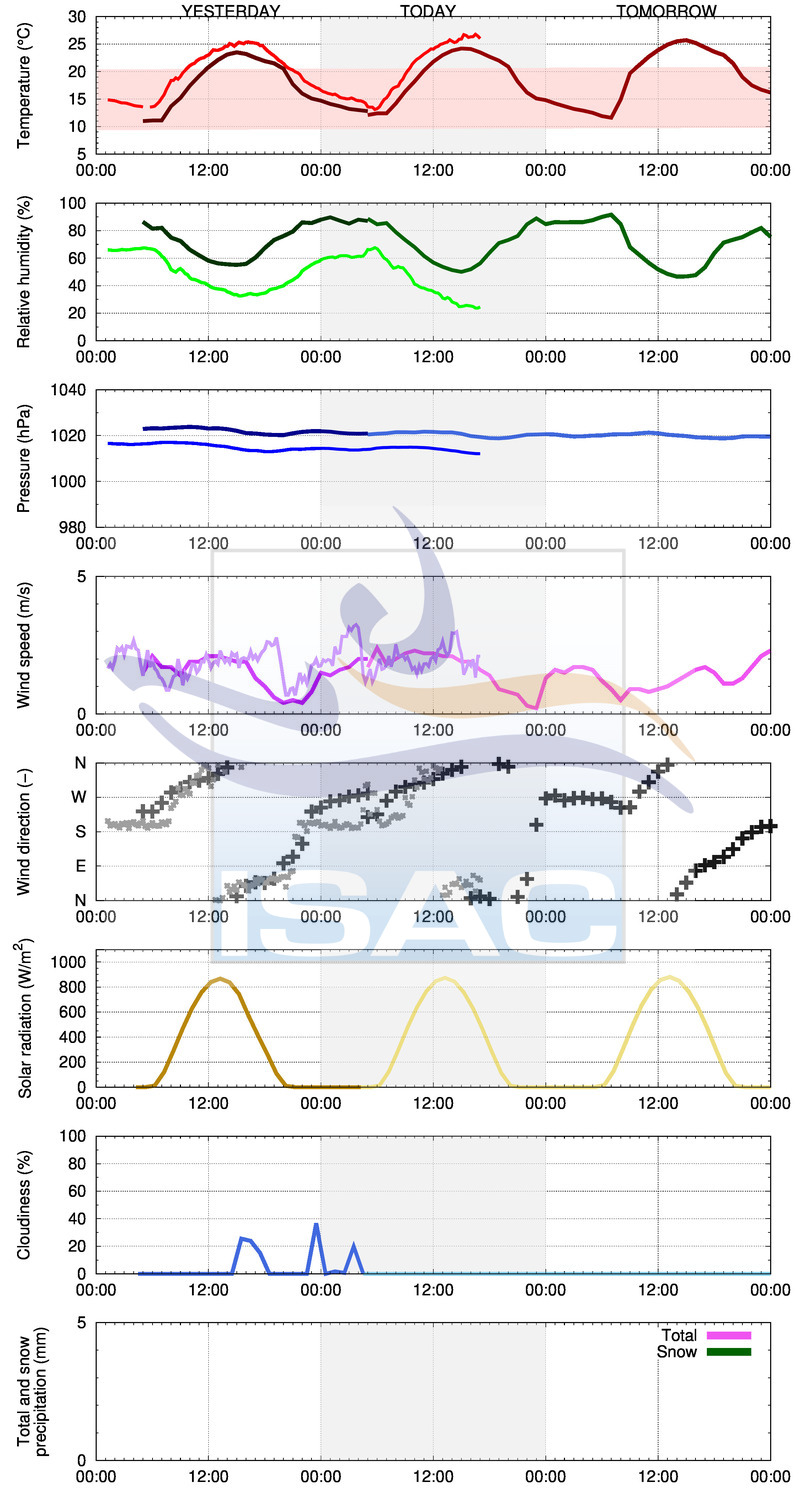
Meteorological data observed today at the Bologna Research Area.
| 20-10-2025 21:41 | Current | Minimum | Average | Maximum |
|---|---|---|---|---|
| Temperature (°C) | 14.2 | 11.8 | 14.2 | 17.4 |
| Relative humidity (%) | 81 | 57 | 70 | 81 |
| Sea level pressure (hPa) | 1003 | 1003 | 1006 | 1011 |
| Wind speed (m/s) | 0.7 | 0.1 | 0.9 | 2.7 |
| Wind direction (° & sector) | 261 (N) | - | 81 (E) | - |
Data observed in the days of yesterday and today (dotted lines) and numerical predictions for the days of today and tomorrow (lighter solid lines). The "prediction" for yesterday (darker solid lines) is shown for a comparison with the observed data. The averages of the observed data are performed over 10 minutes, while the numerical value of the model predictions were computed with an hourly resolution. The colored stripe is the range of temperature variation between the climate averages of the minimum and maximum (daily values for the period 1971-2000). The UV index is calculated on the basis of radiometric measurements (see risk table).
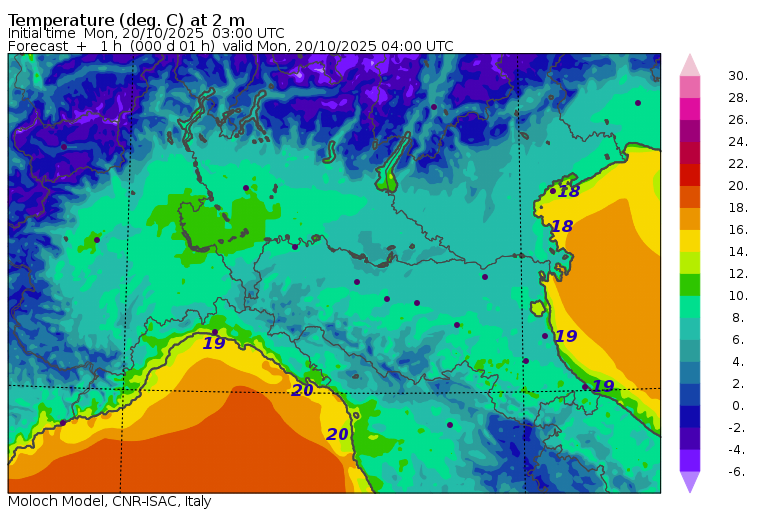
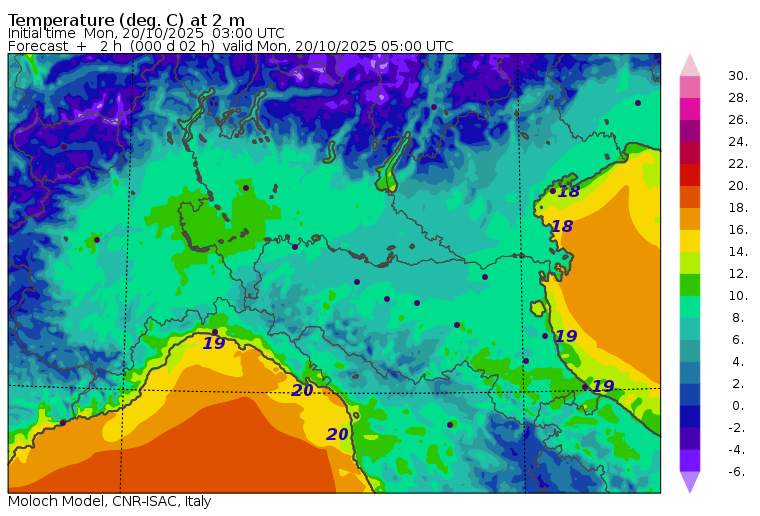
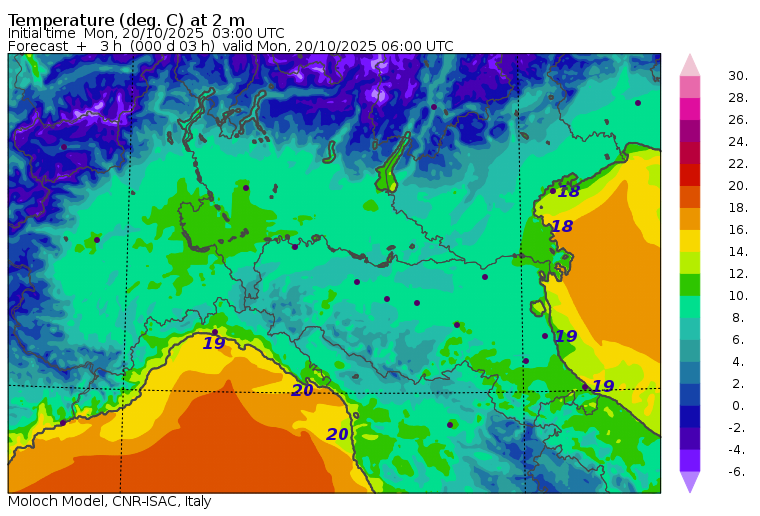
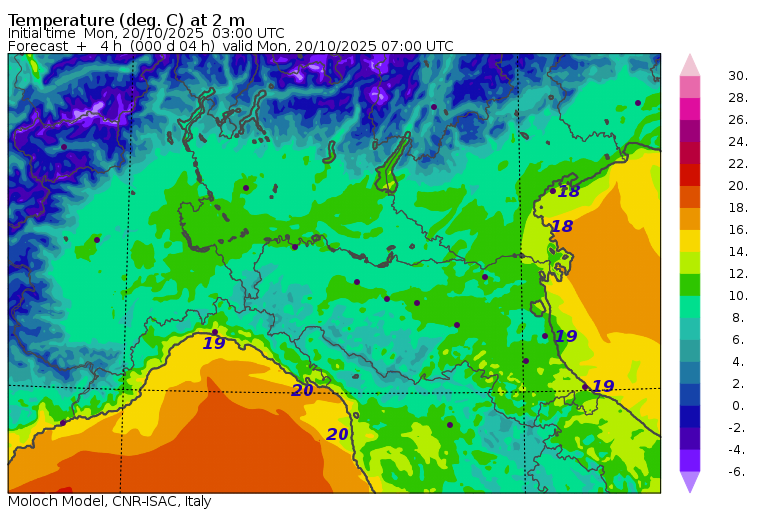
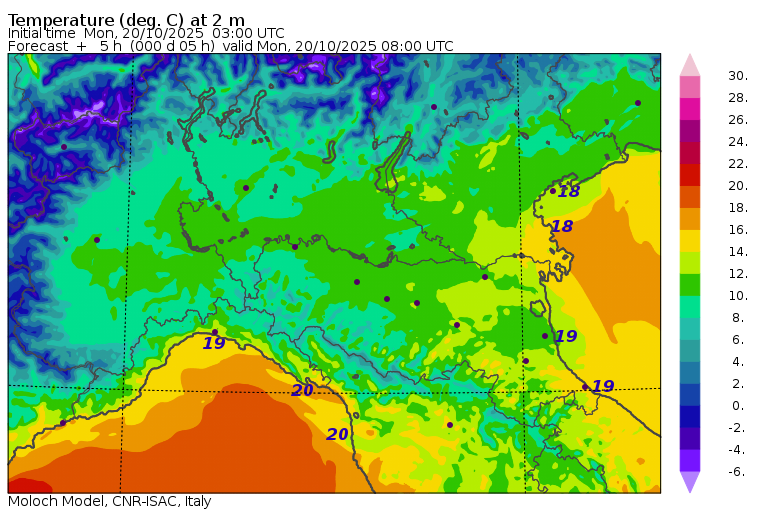
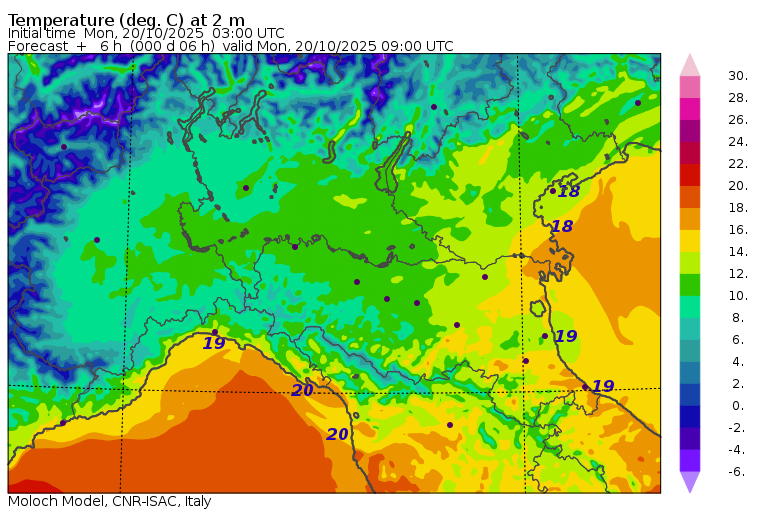
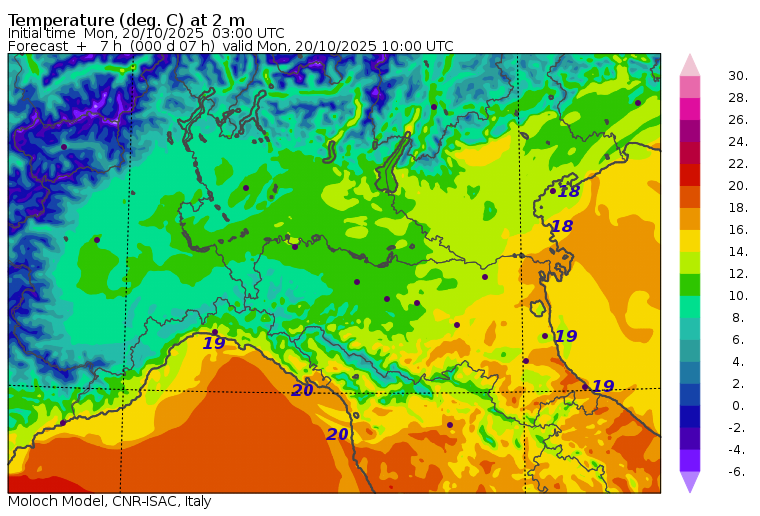
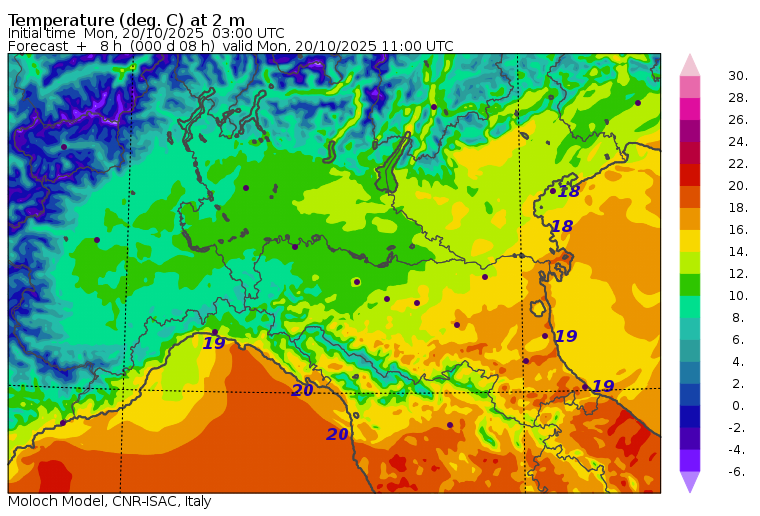
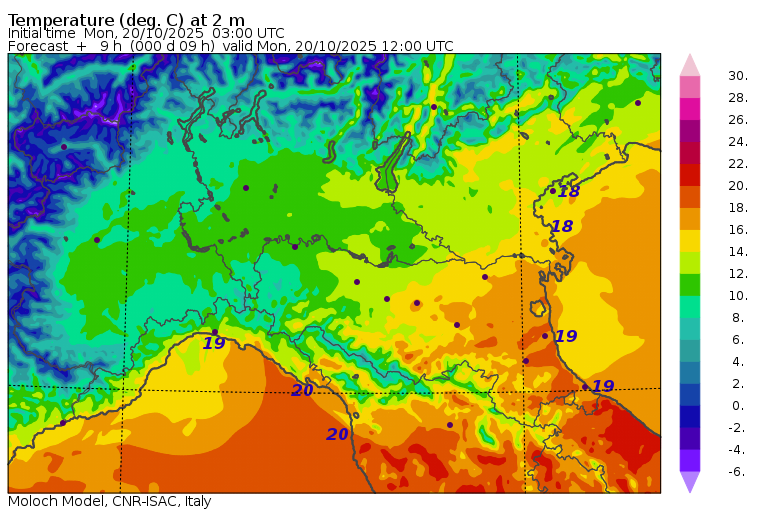
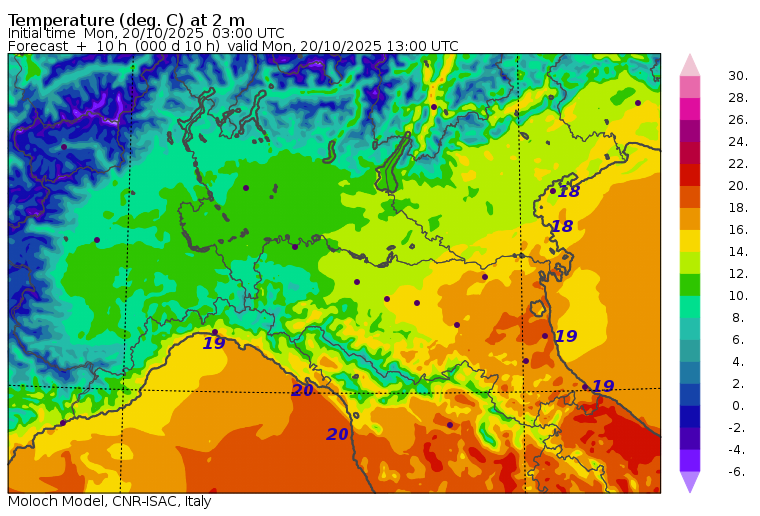
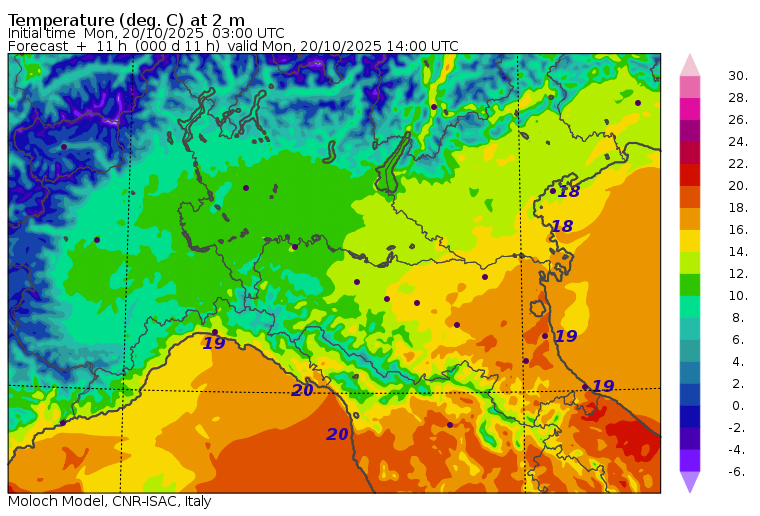
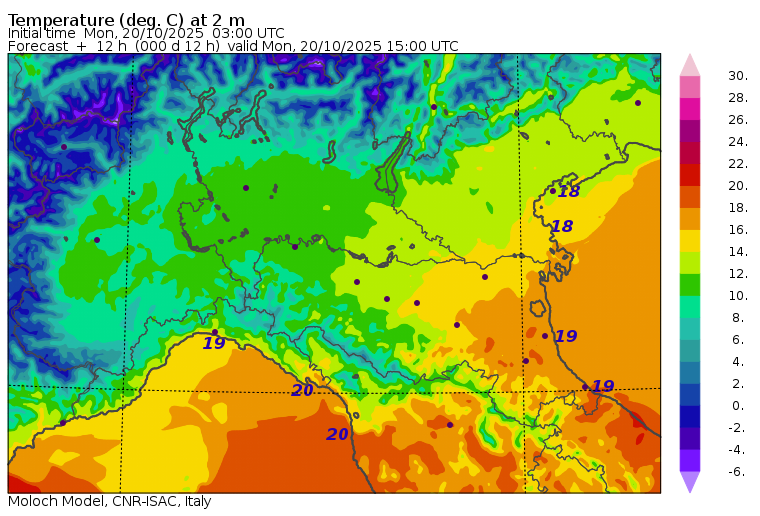
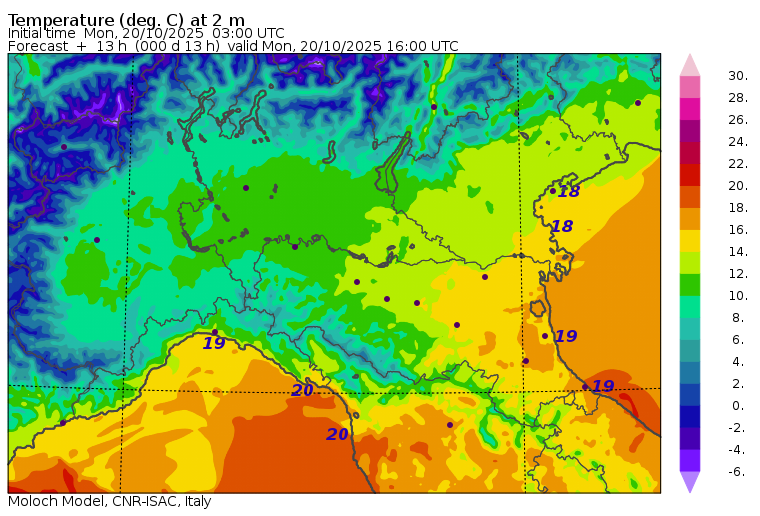
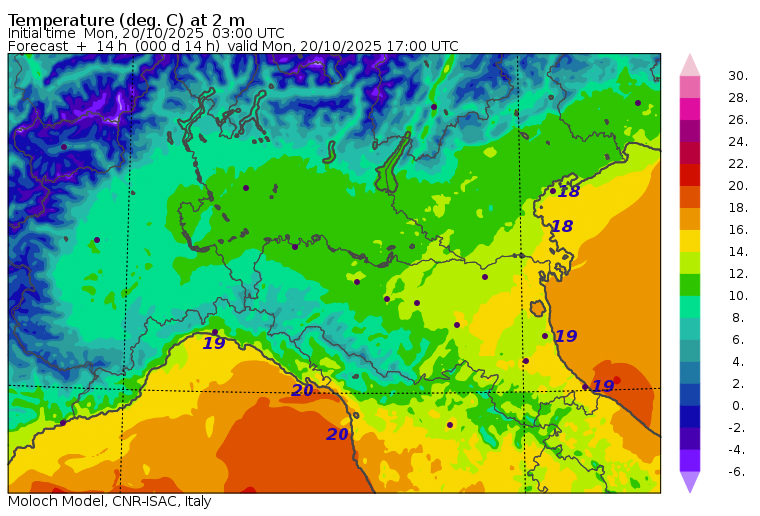
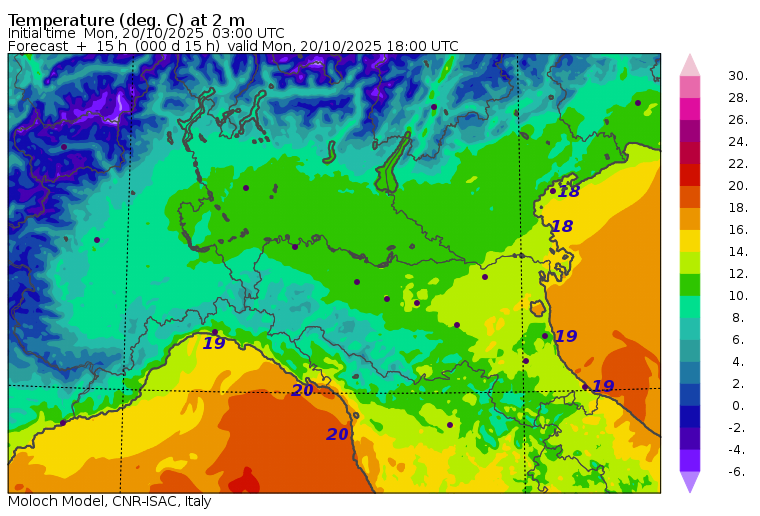
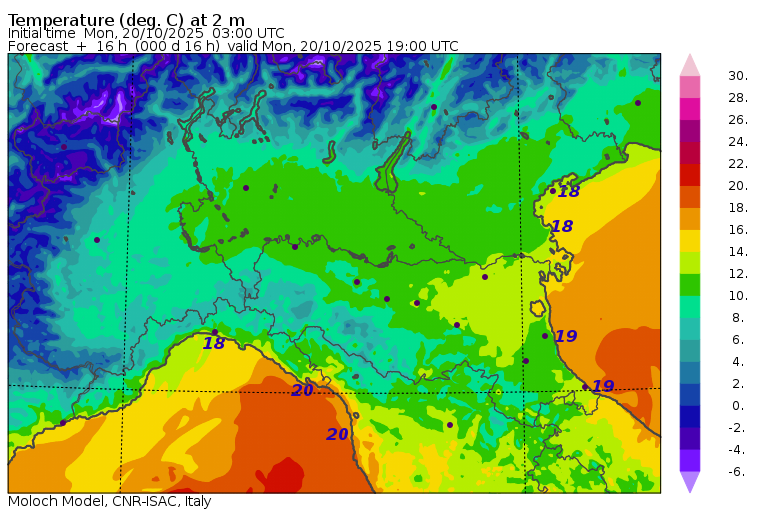
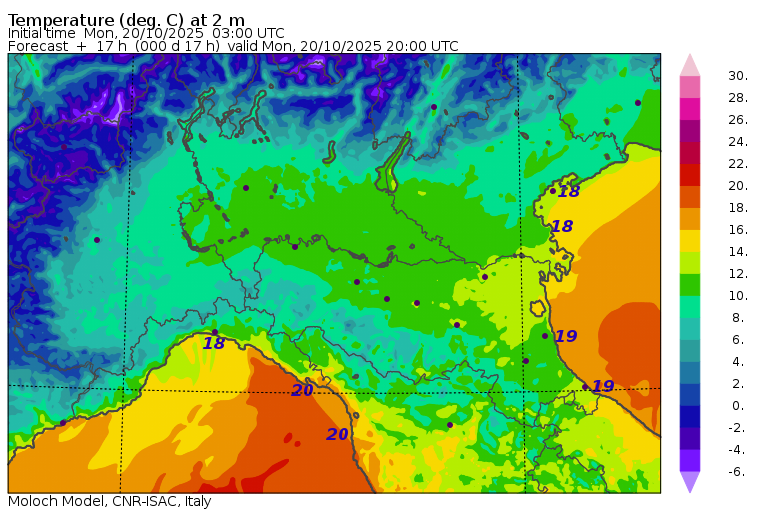
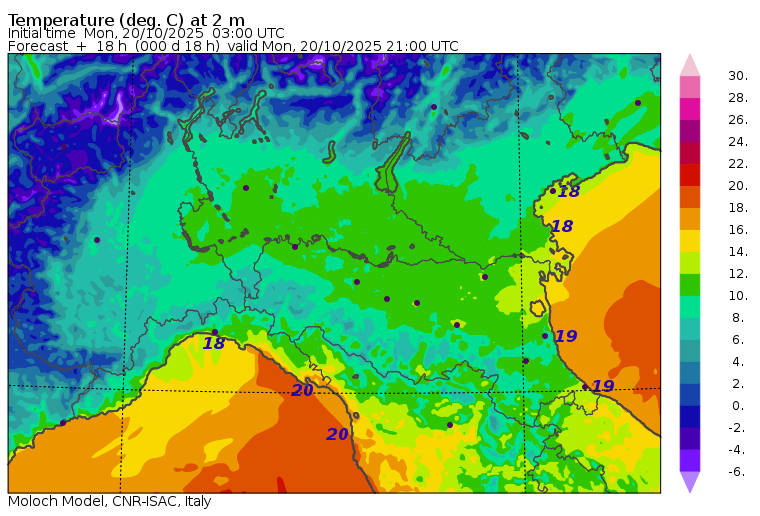
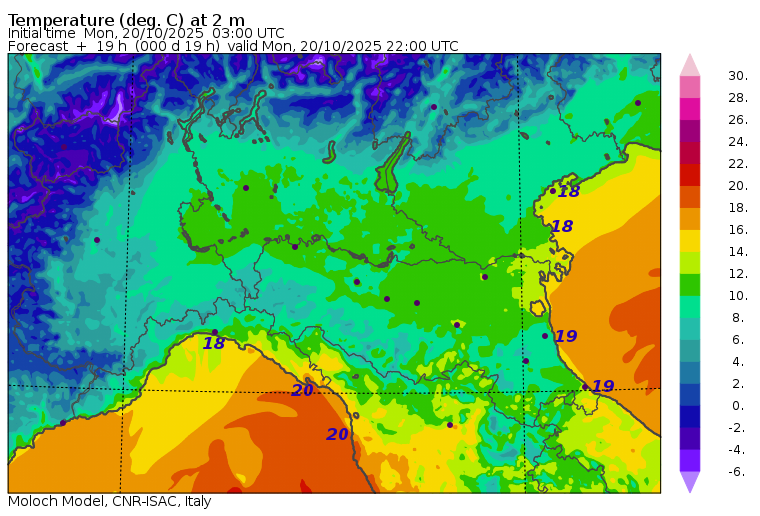
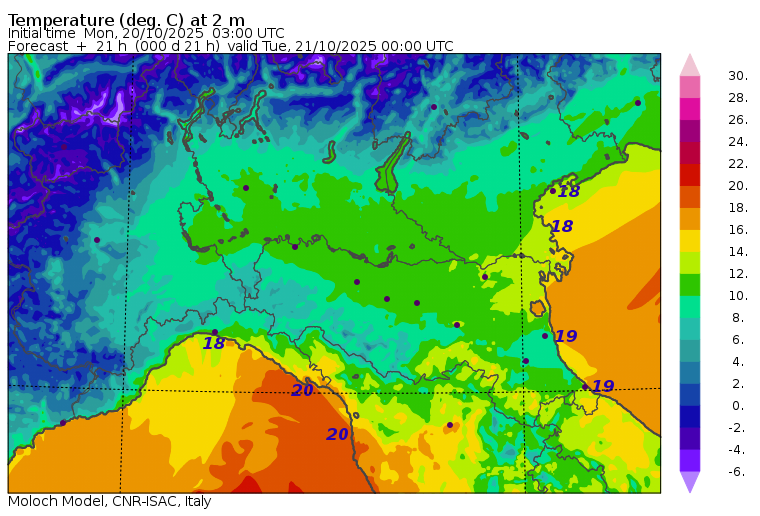
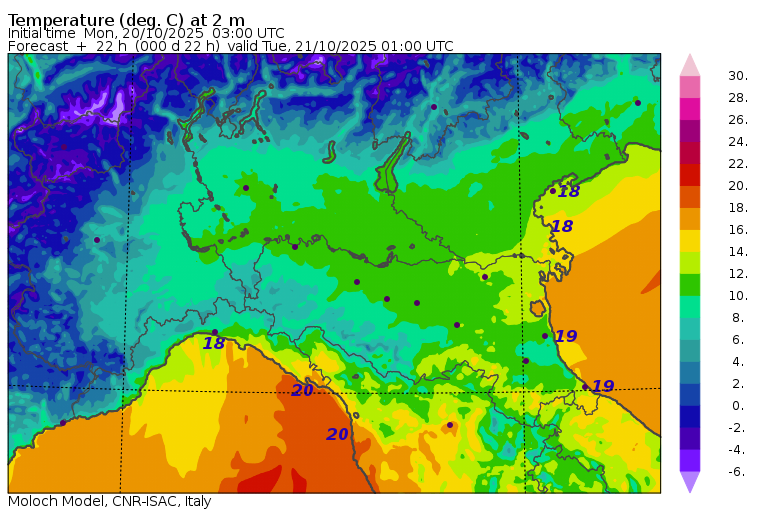
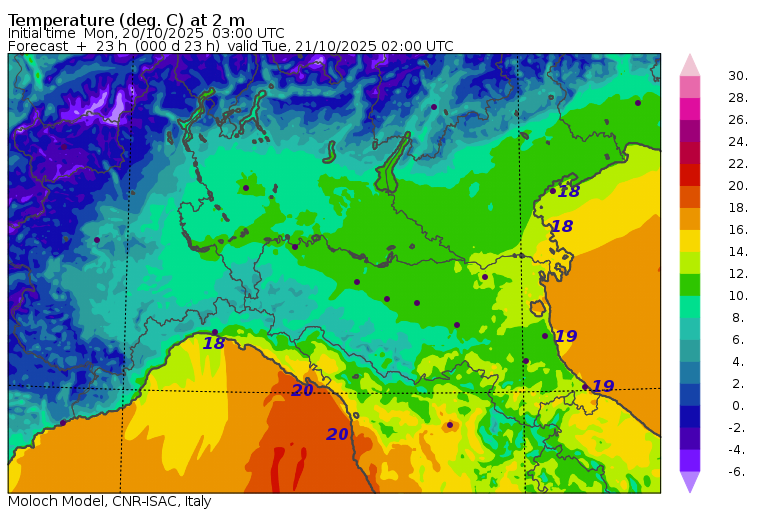
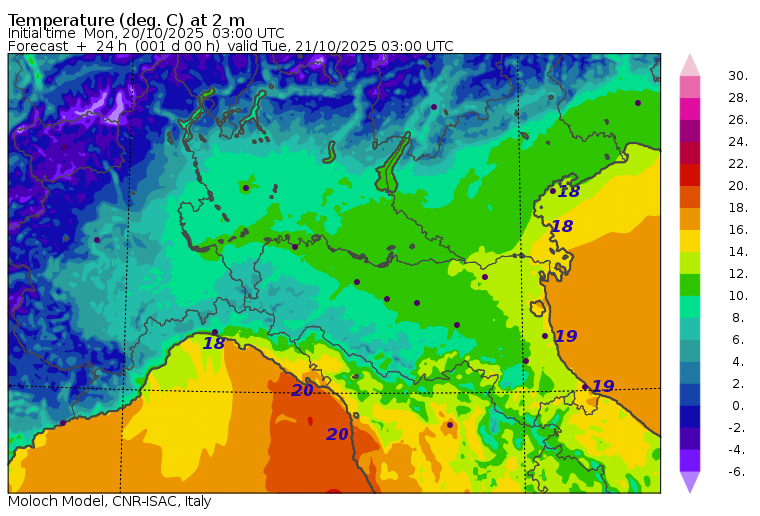
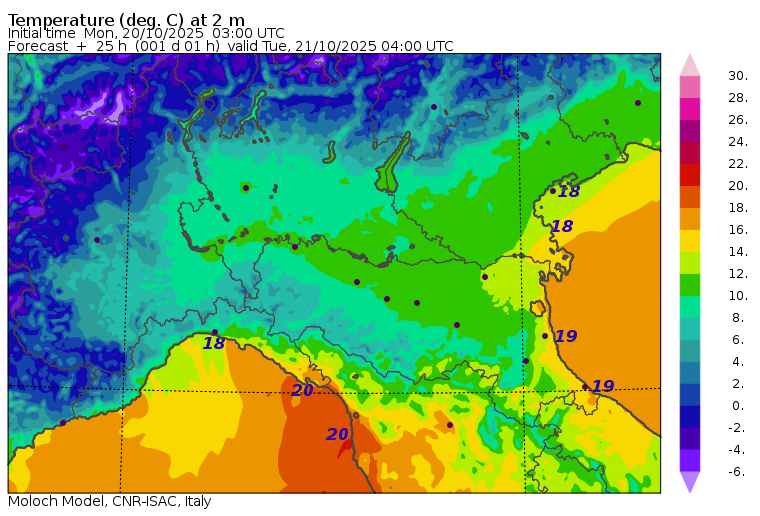
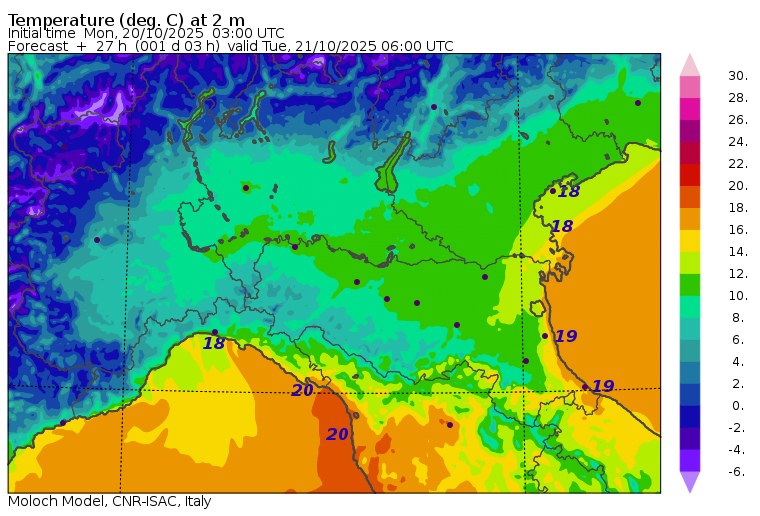
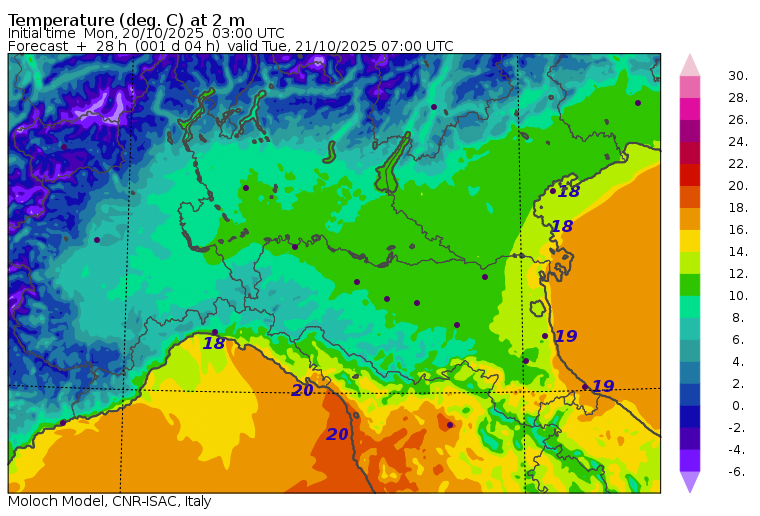
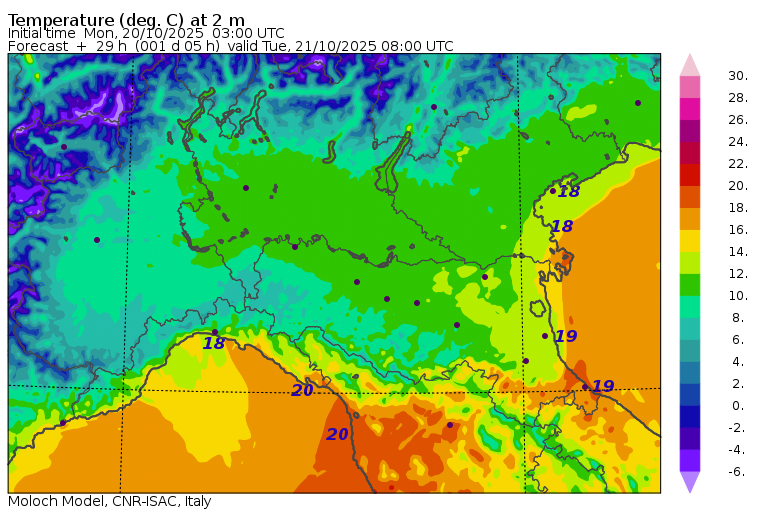
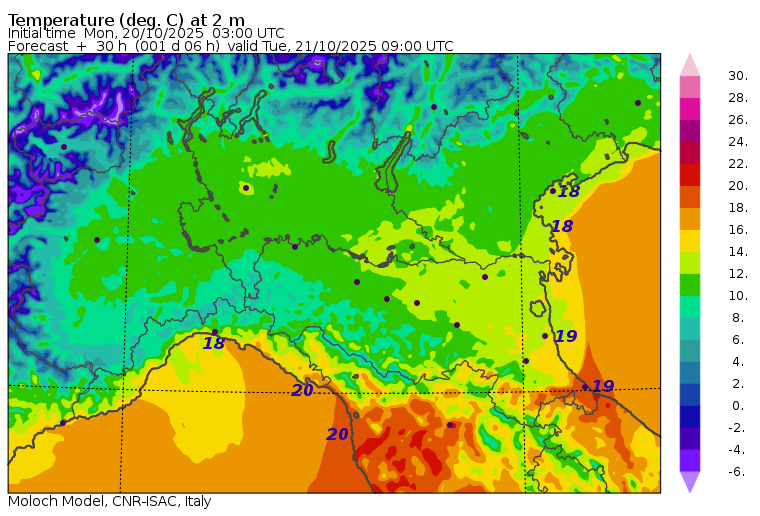
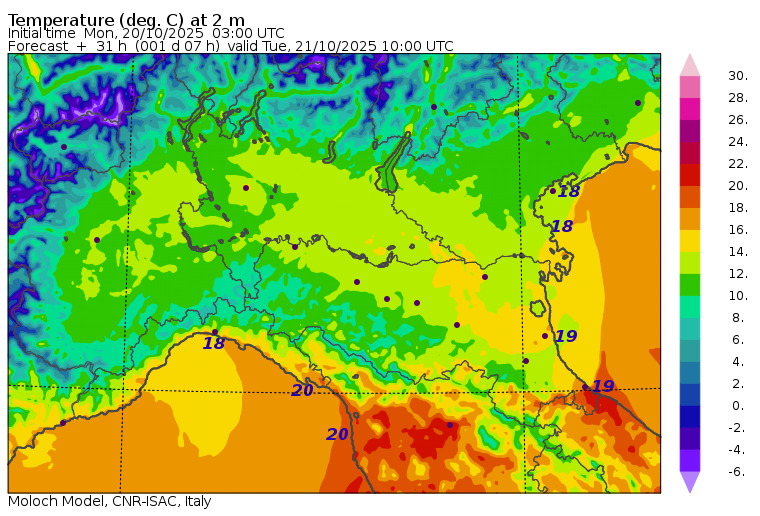
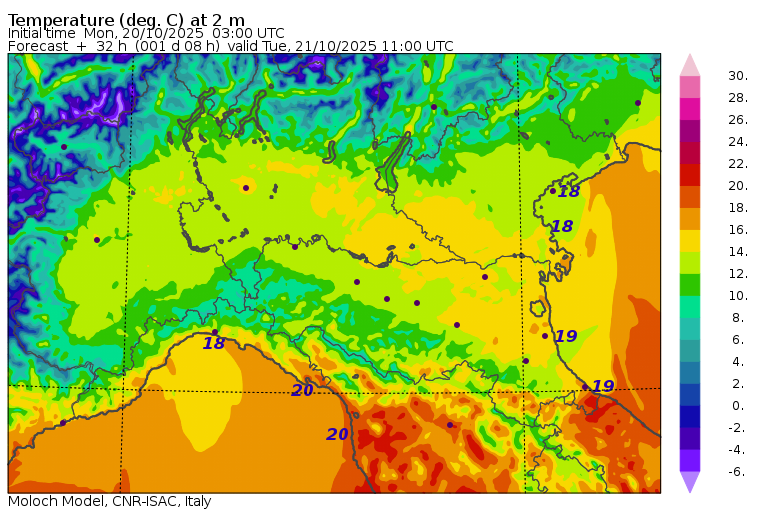
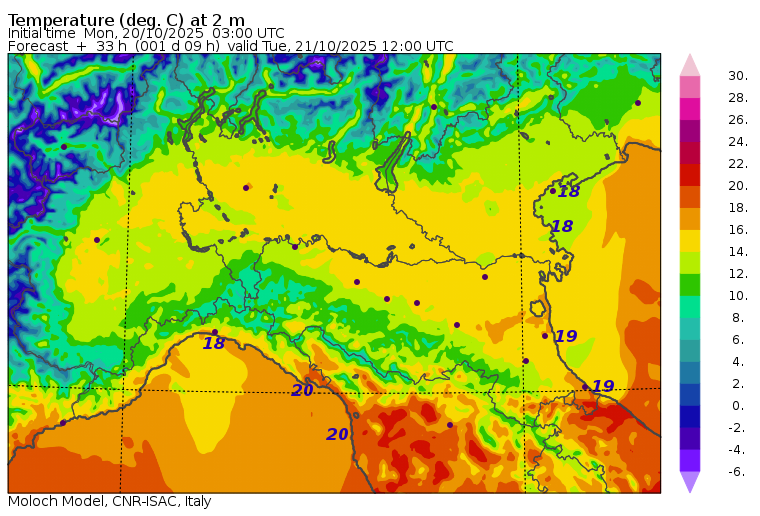
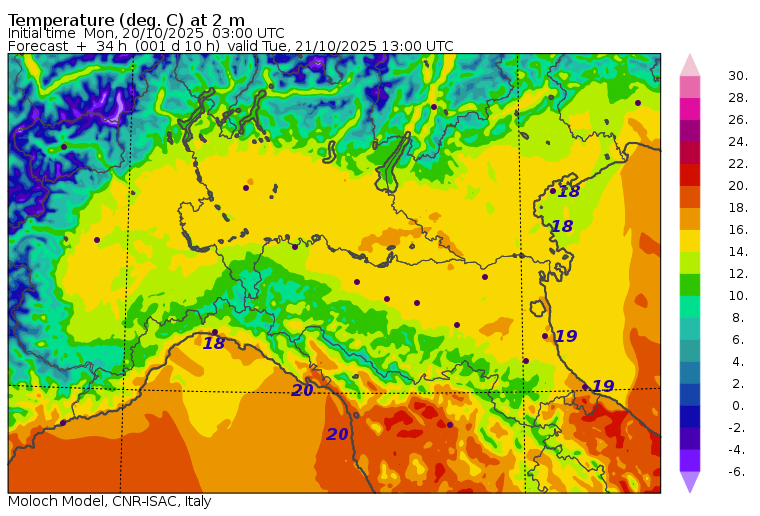
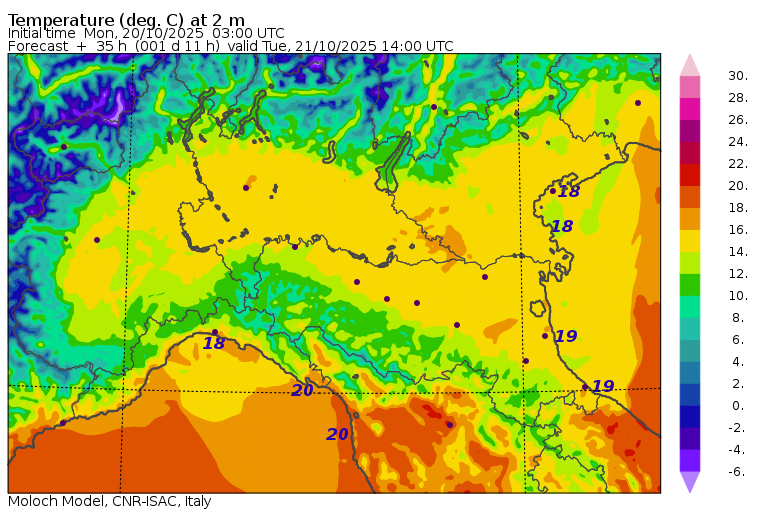
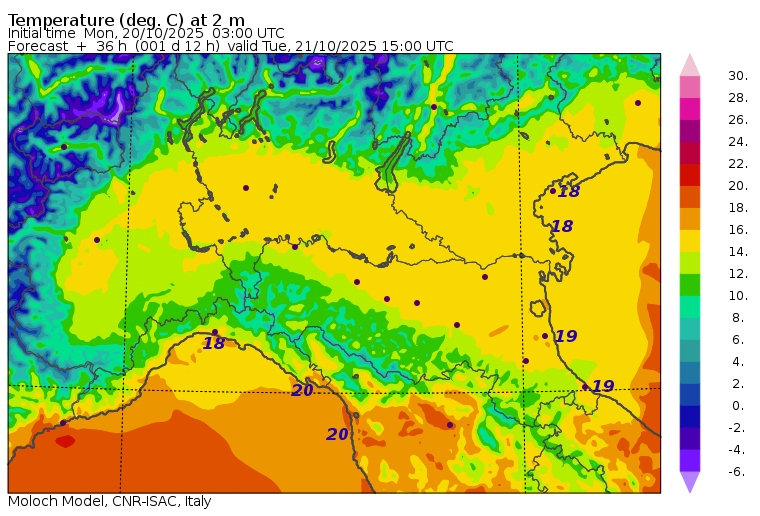
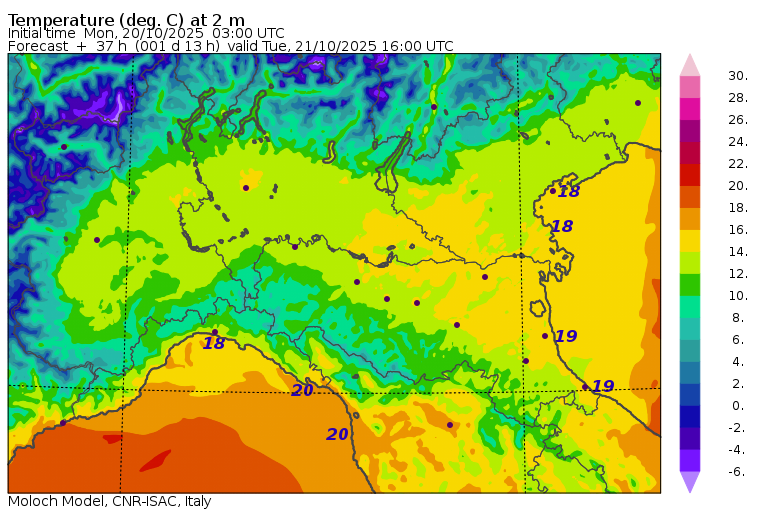
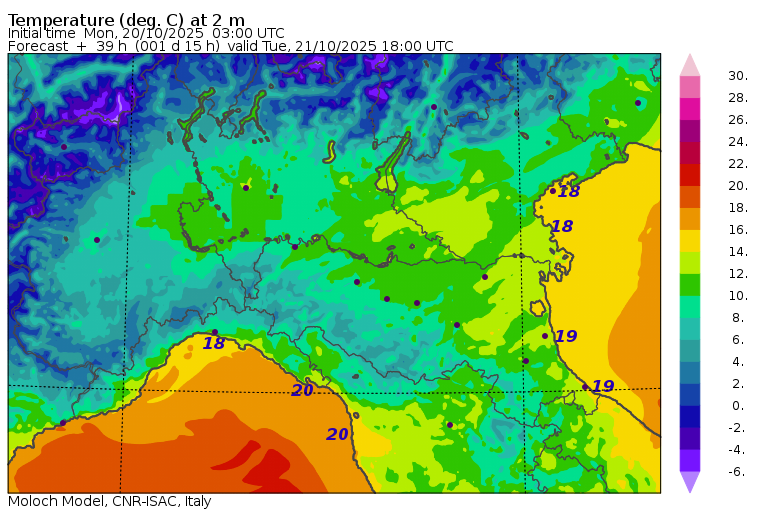
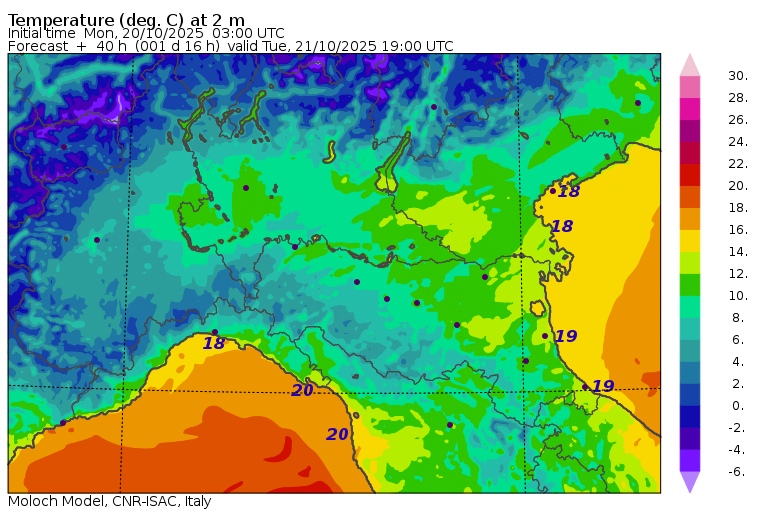
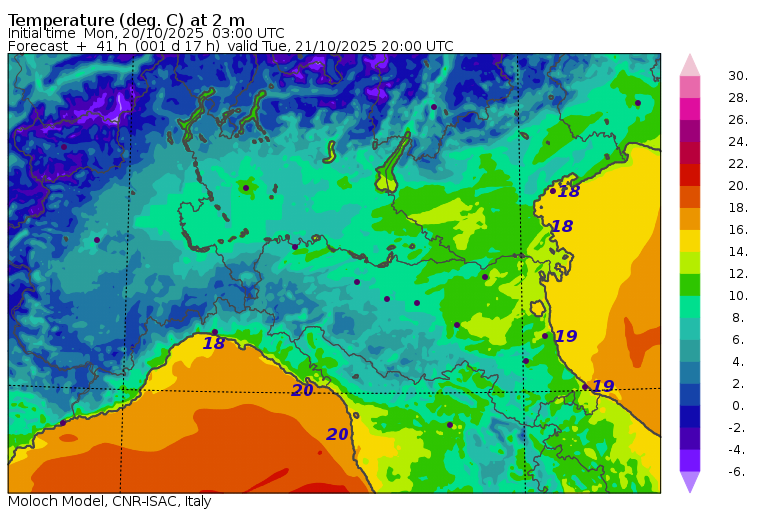
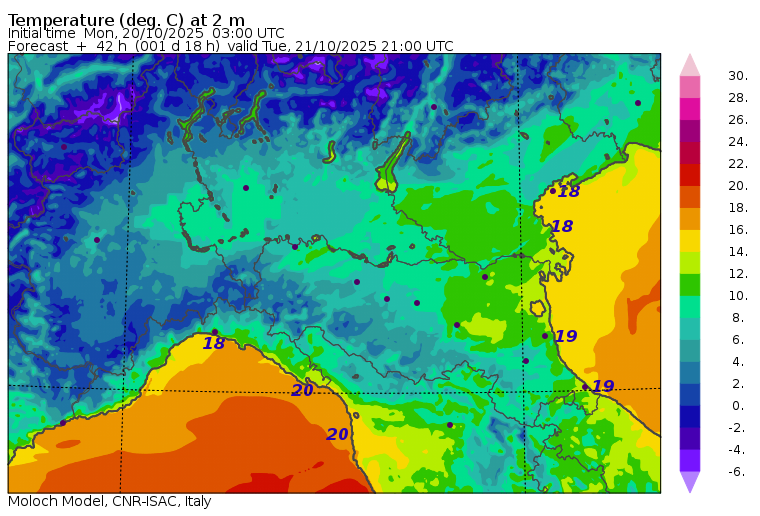
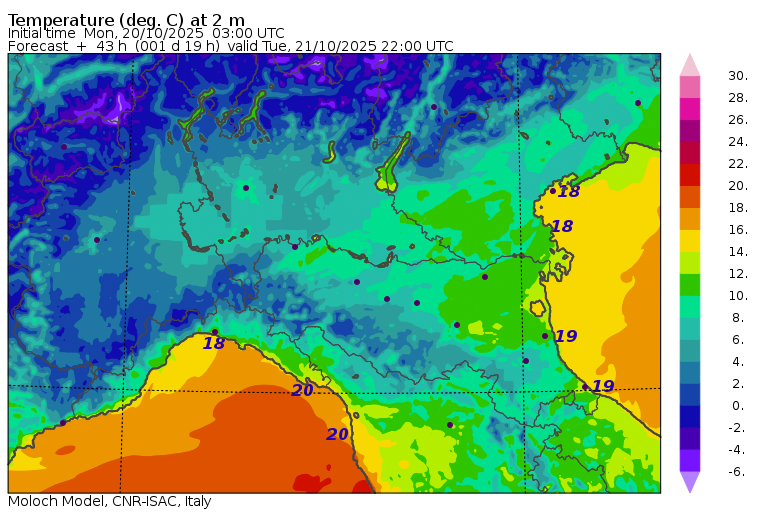
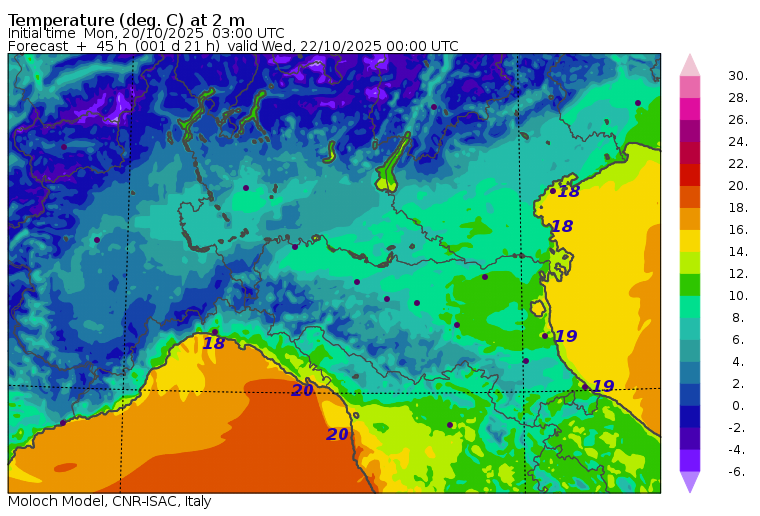
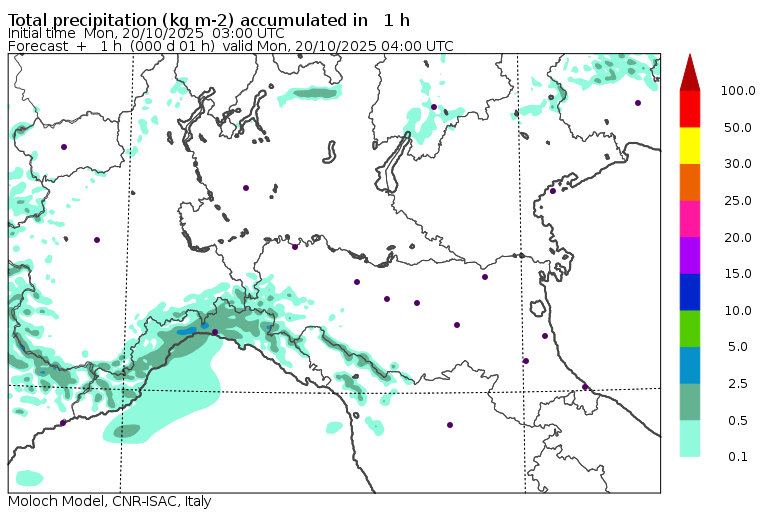
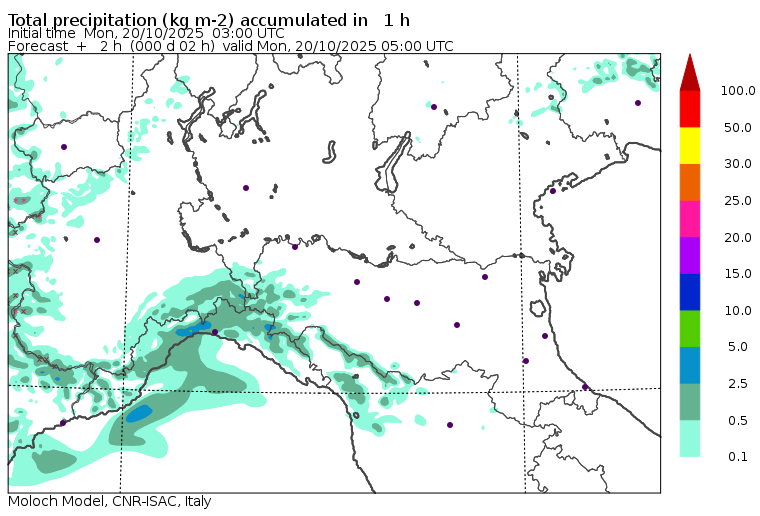
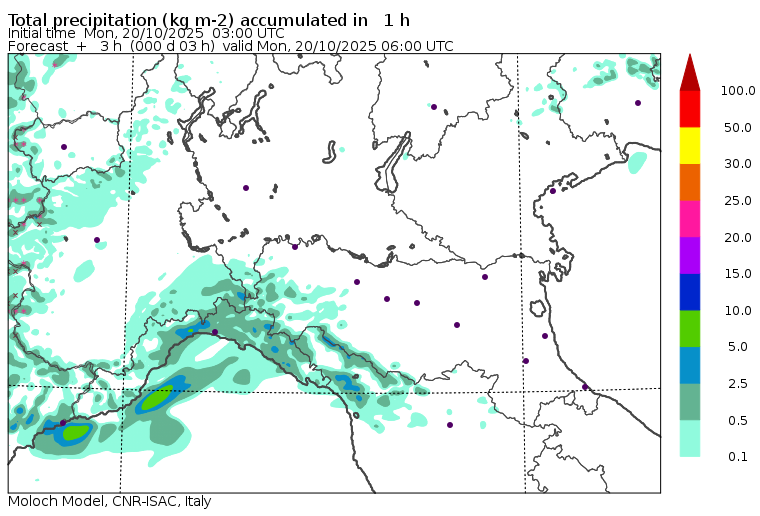
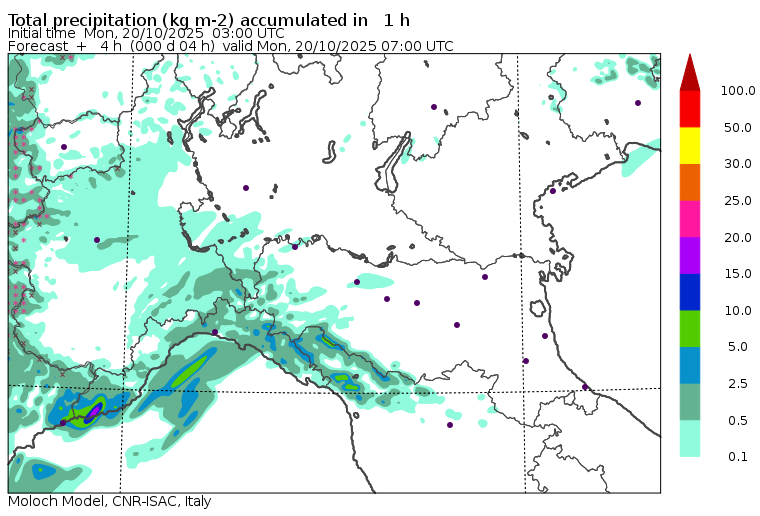
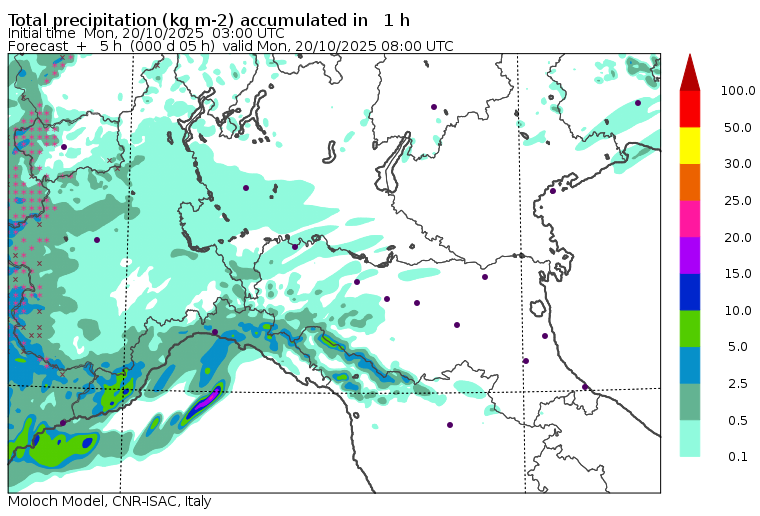
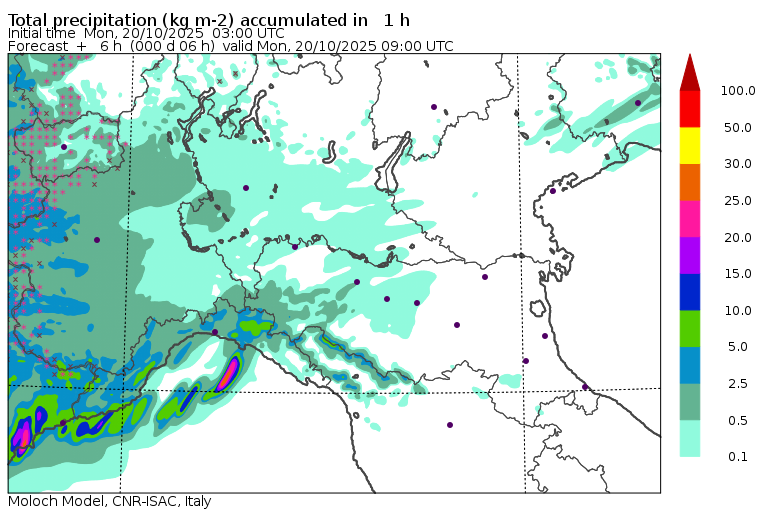
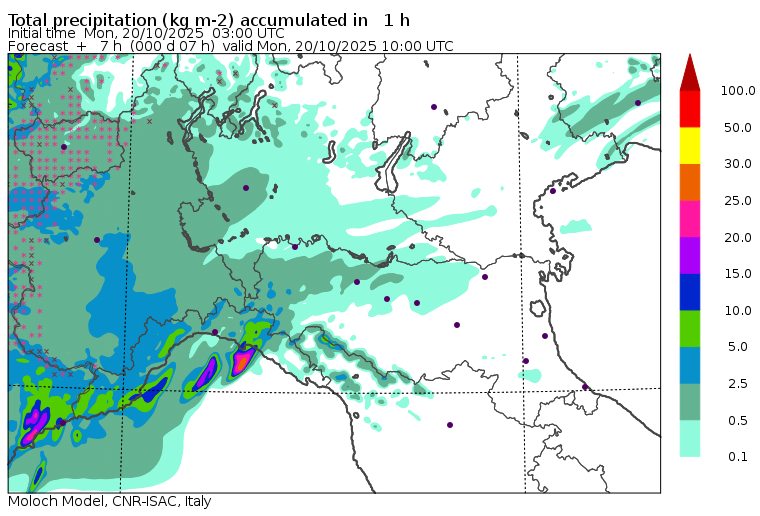
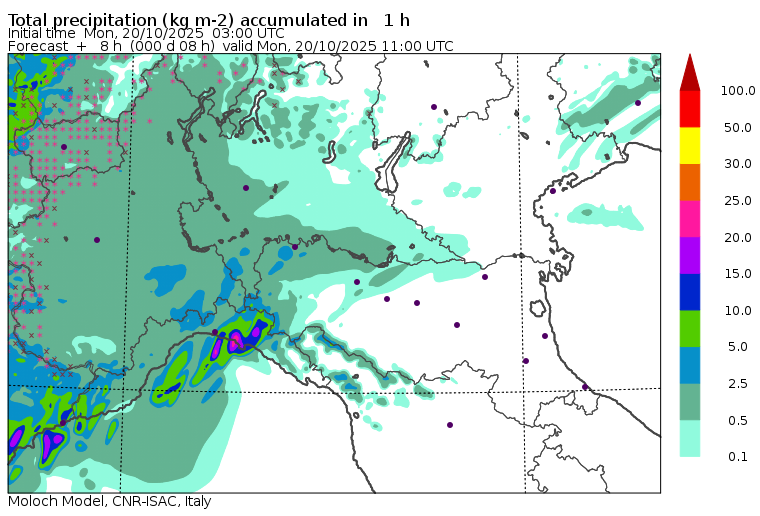
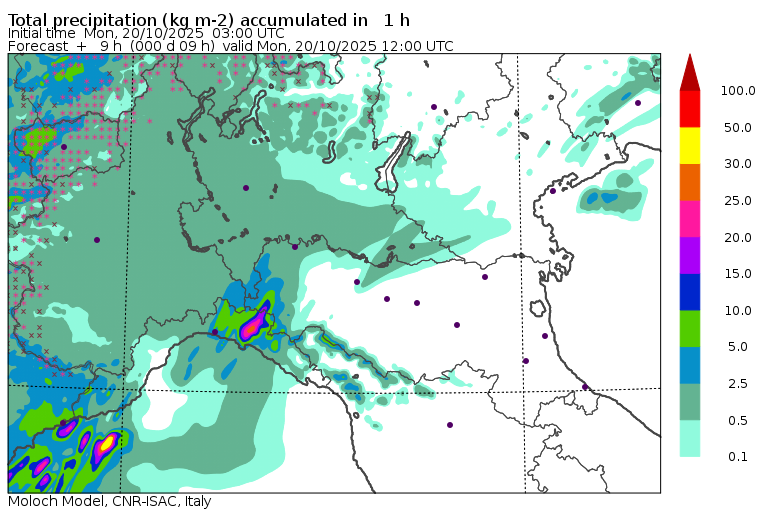
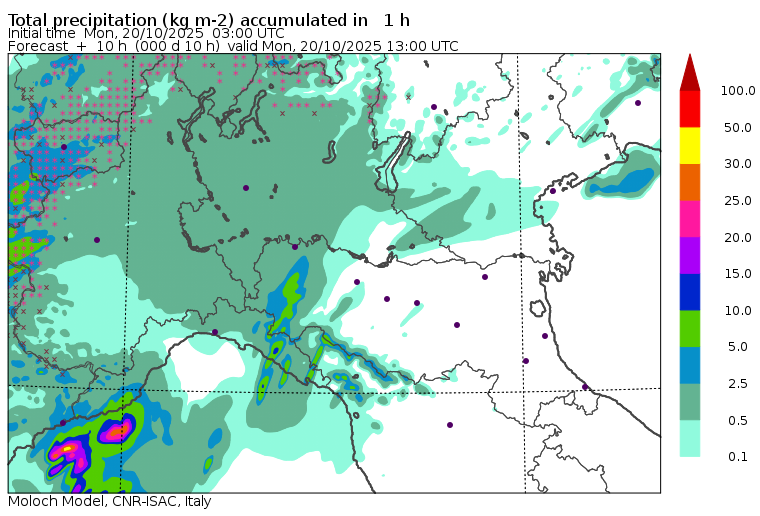
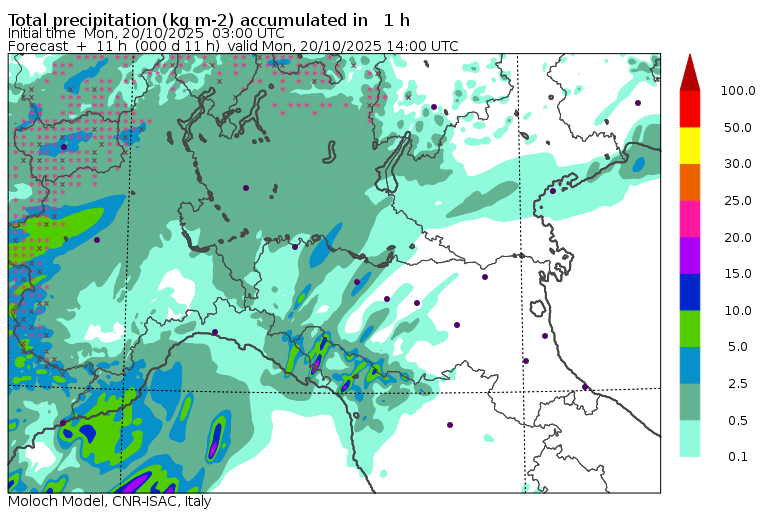
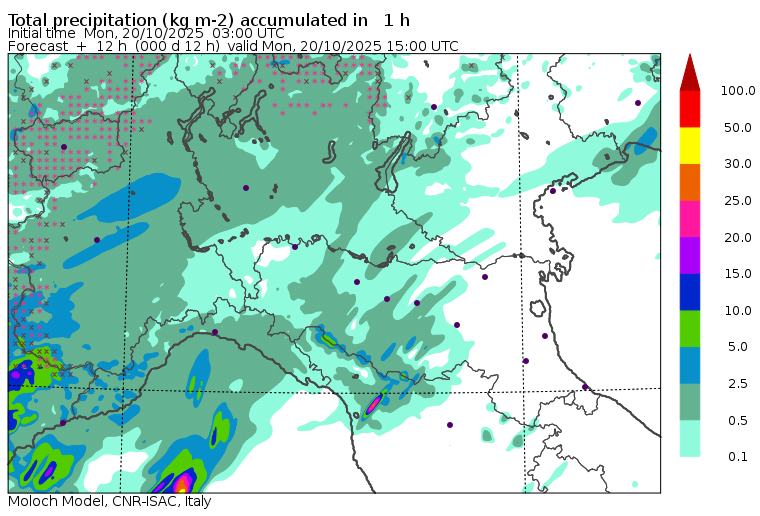
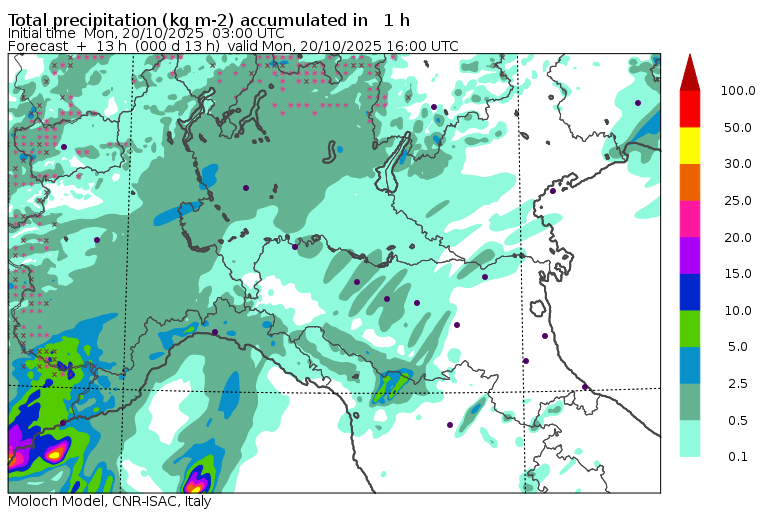
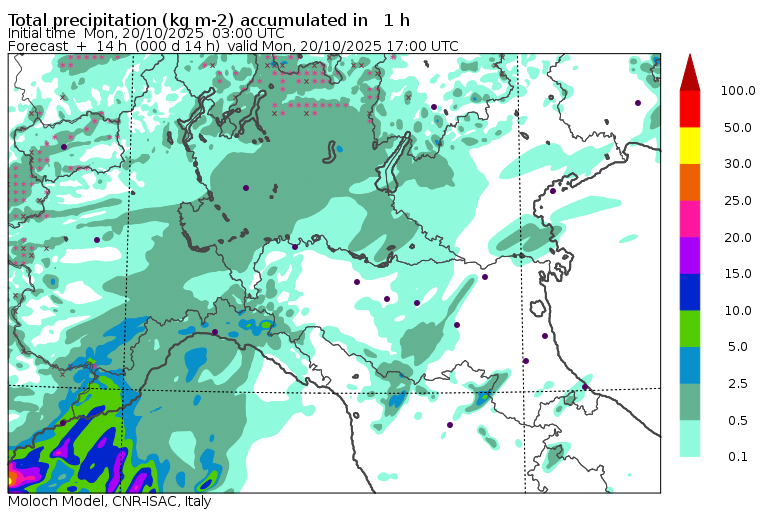
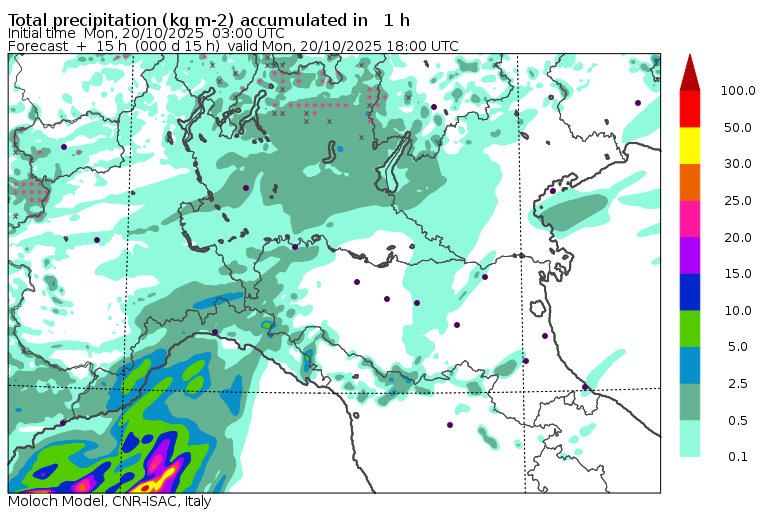
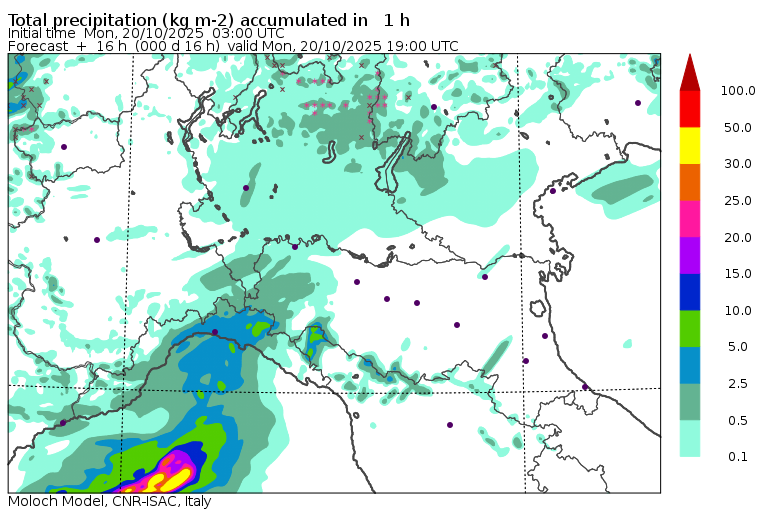
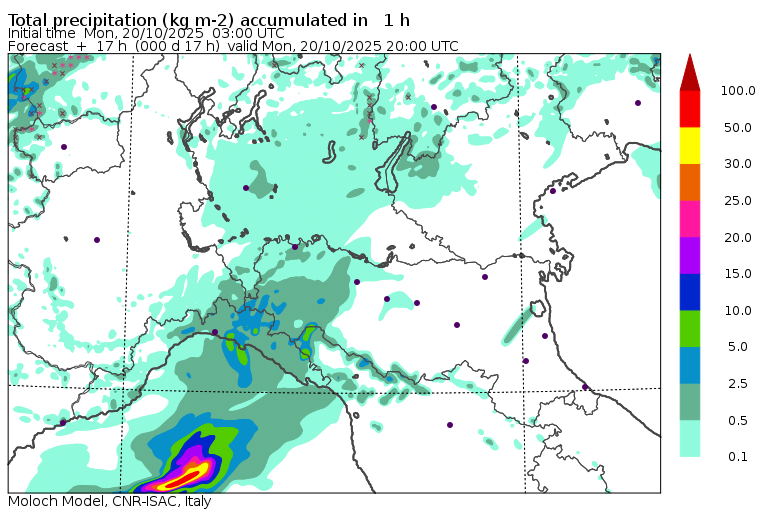
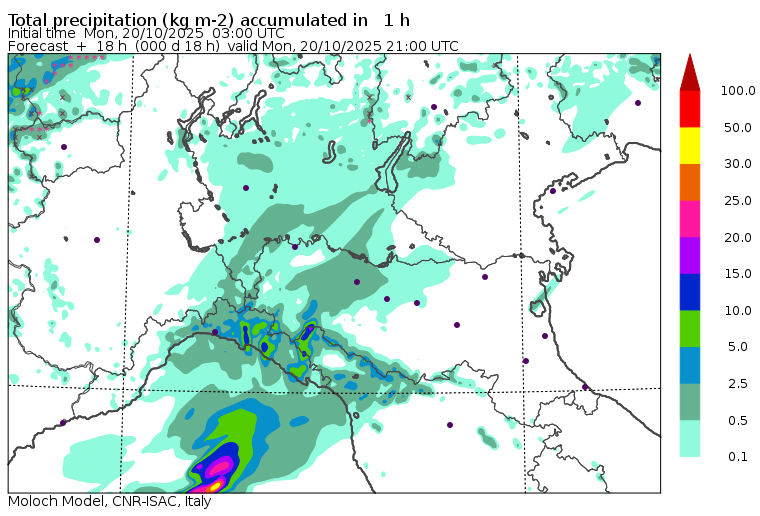
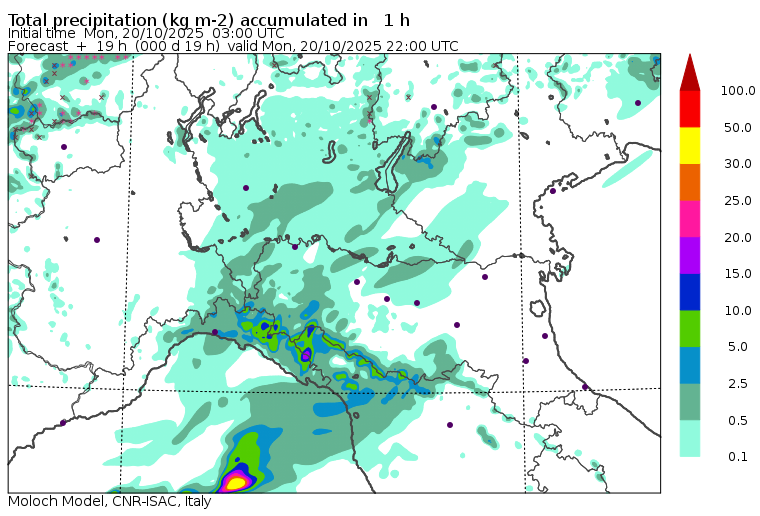
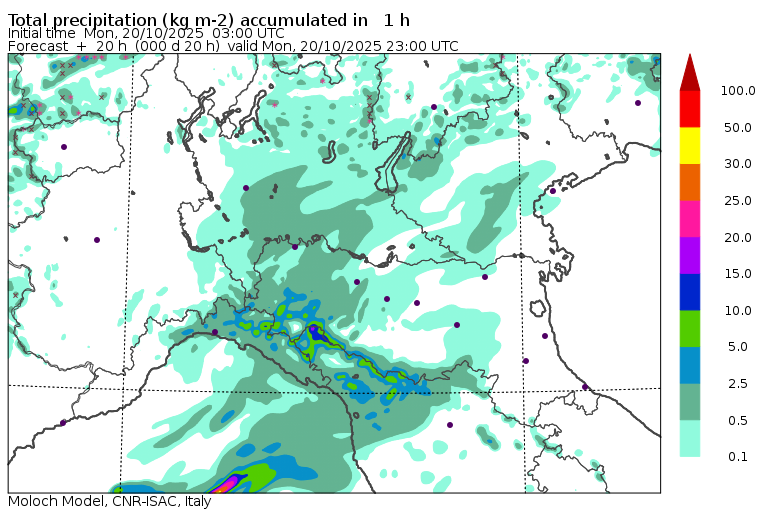
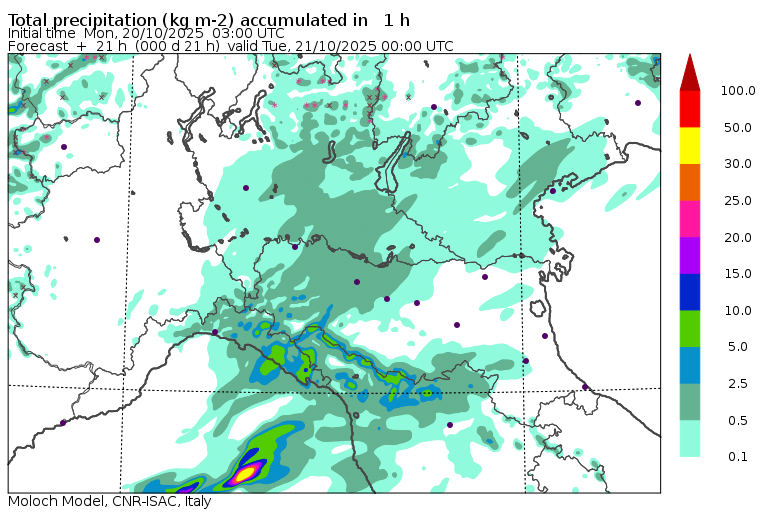
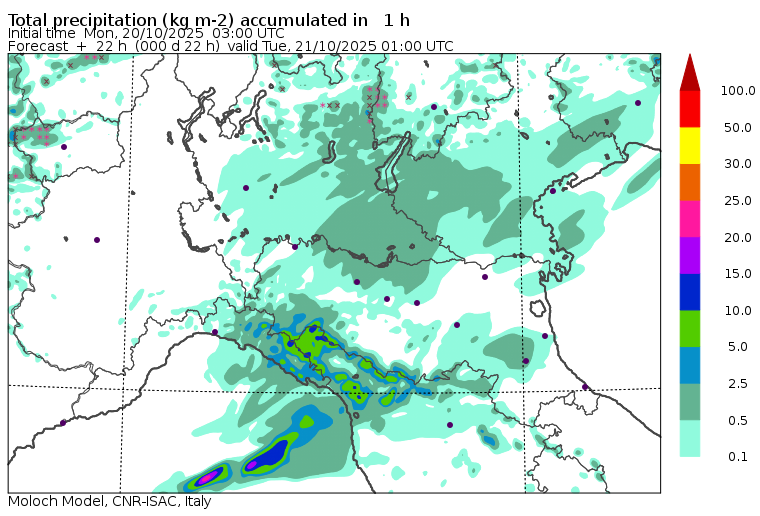
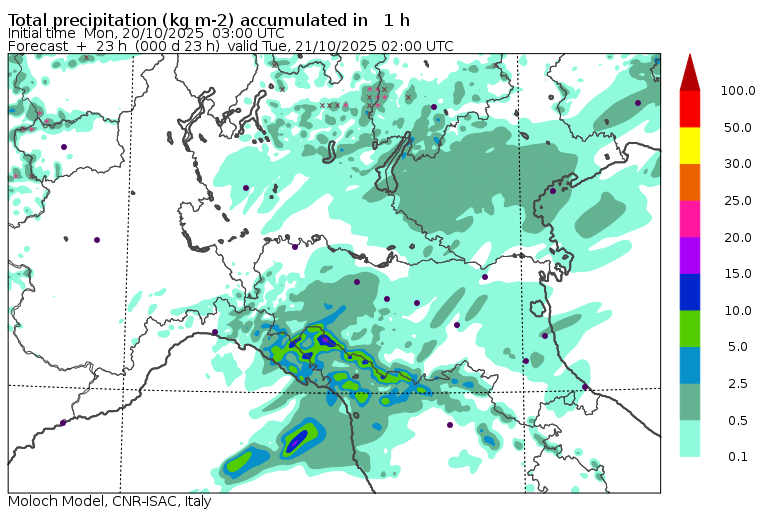
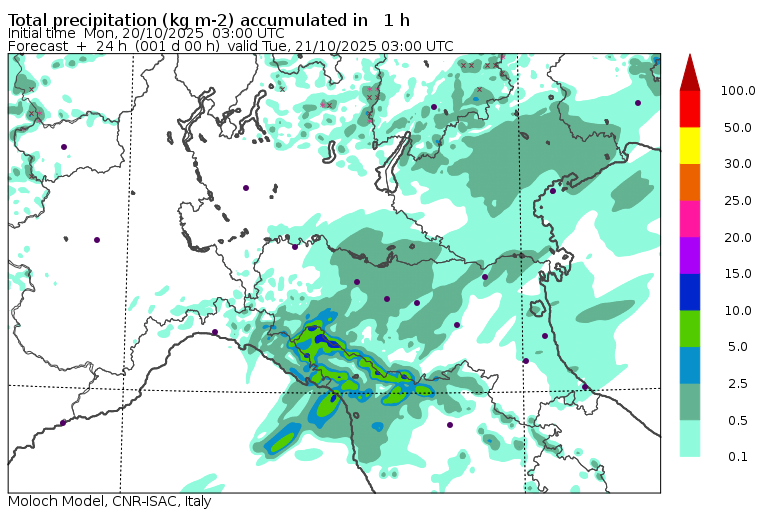
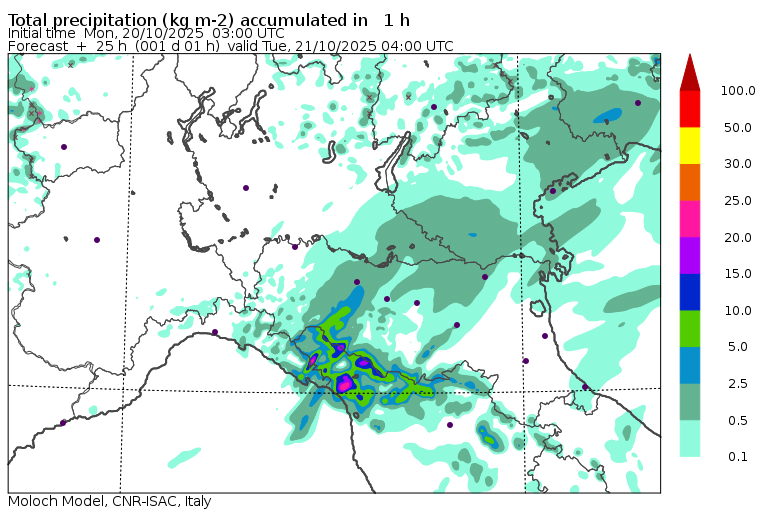
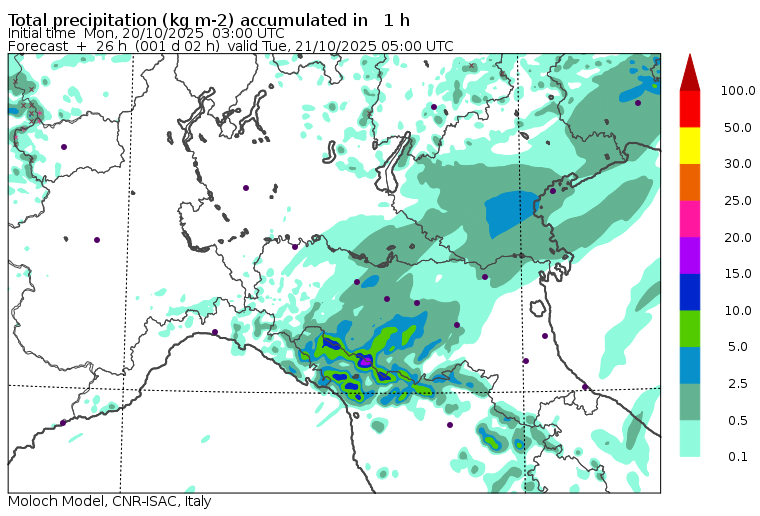
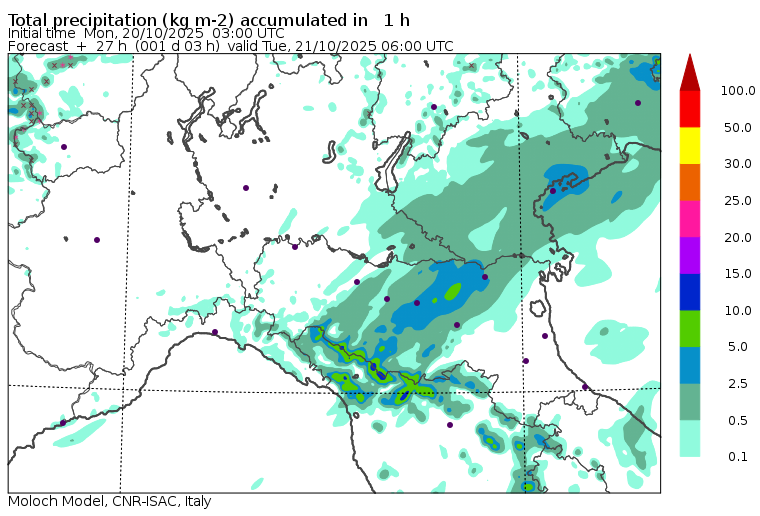
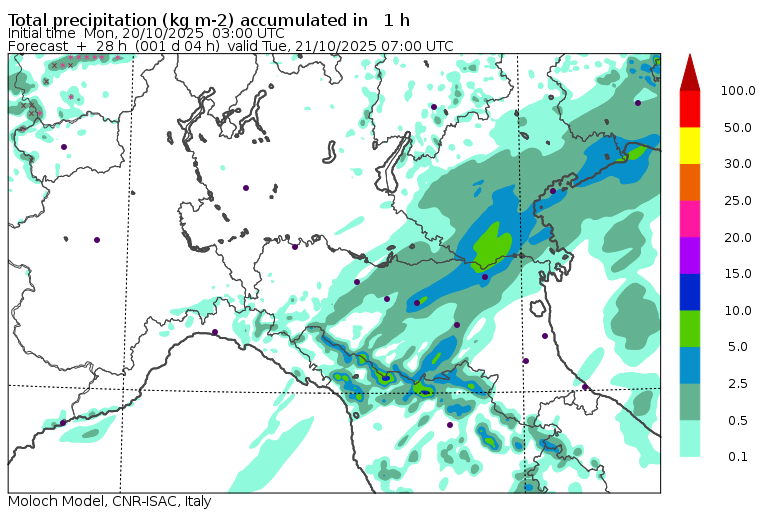
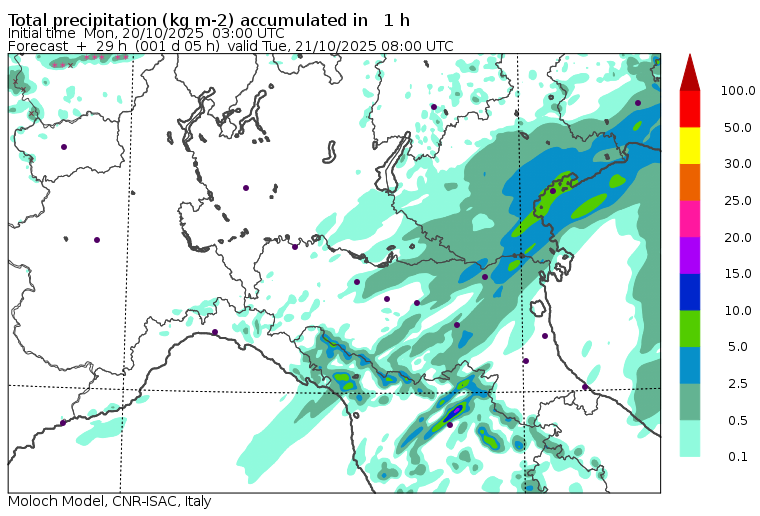
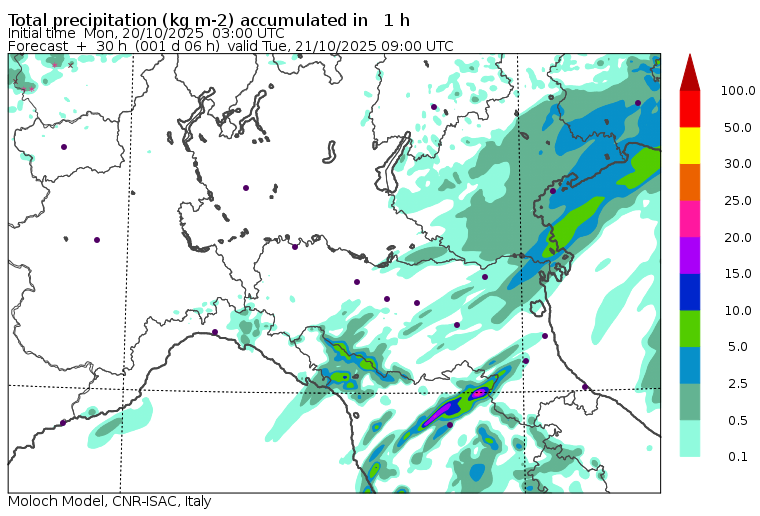
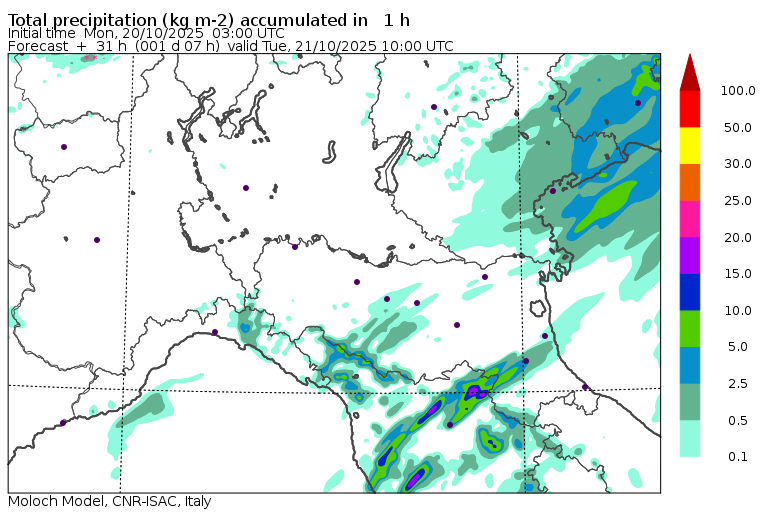
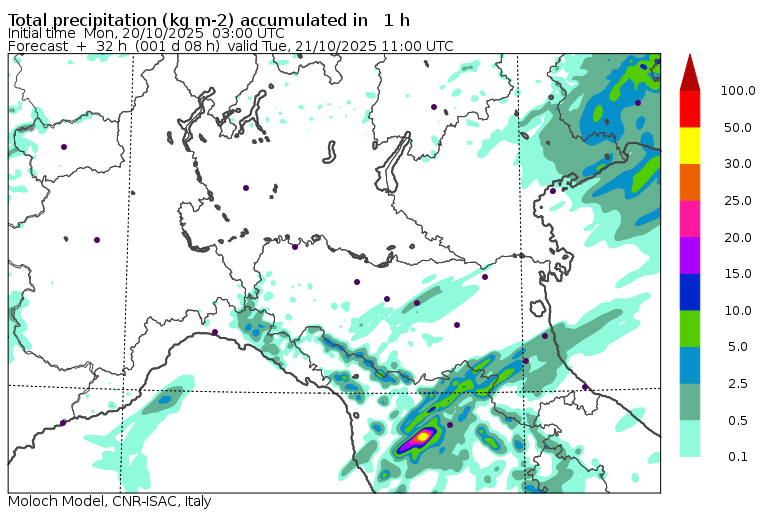
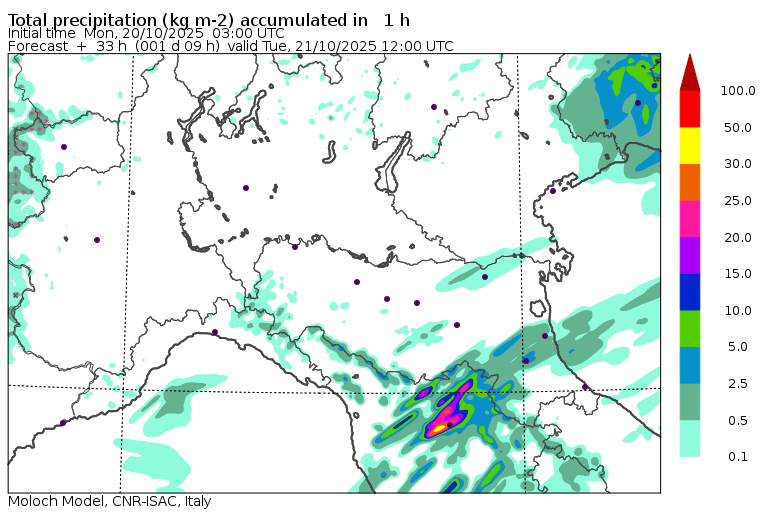
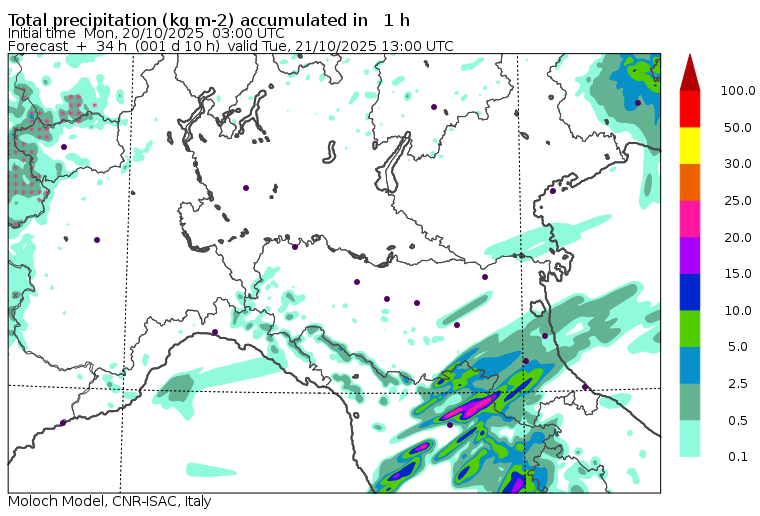
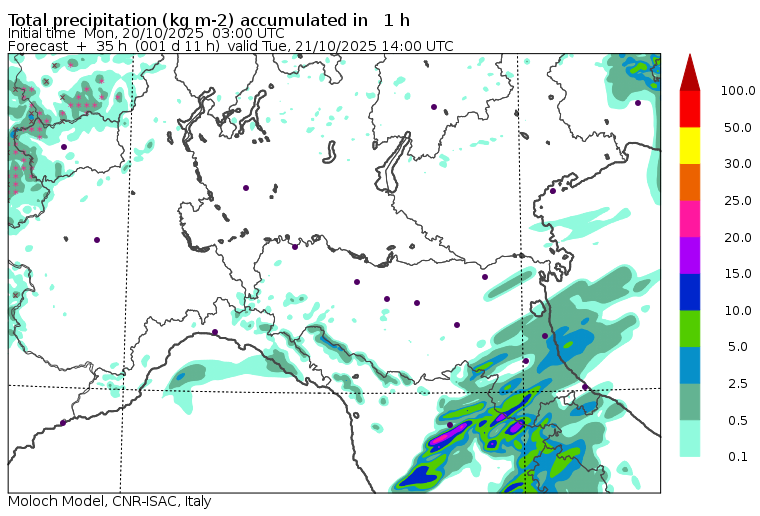
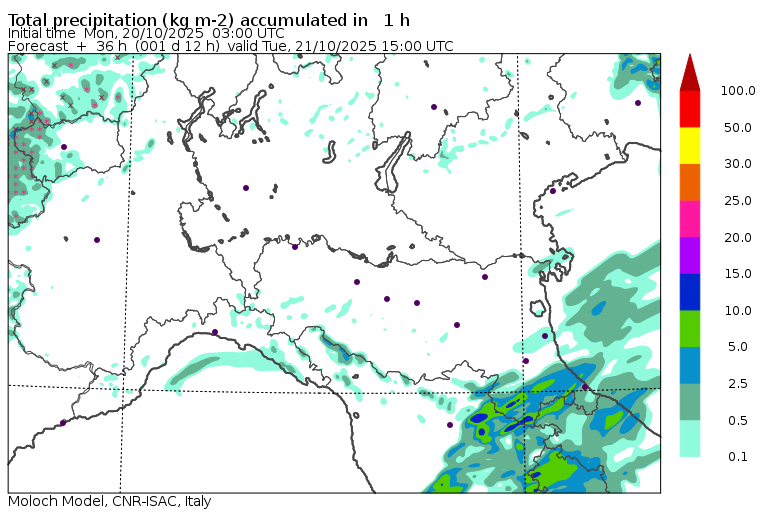
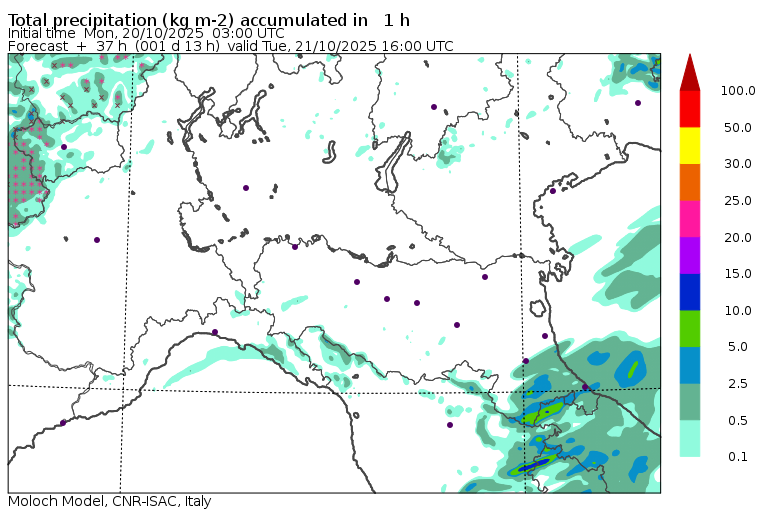
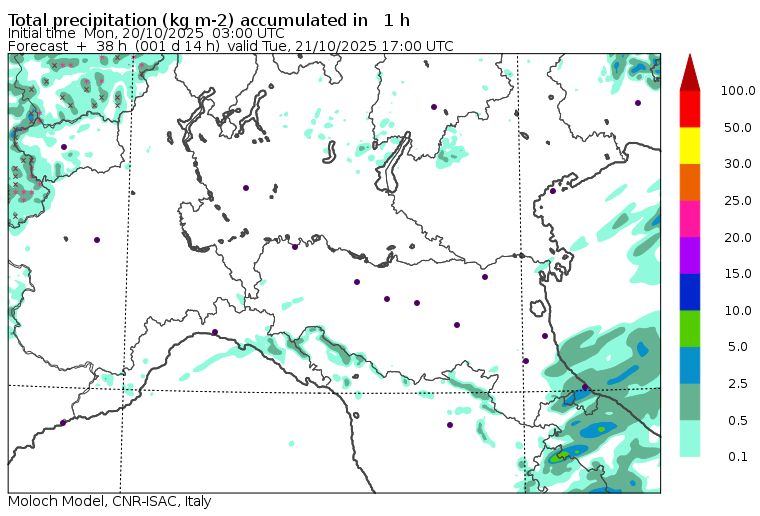
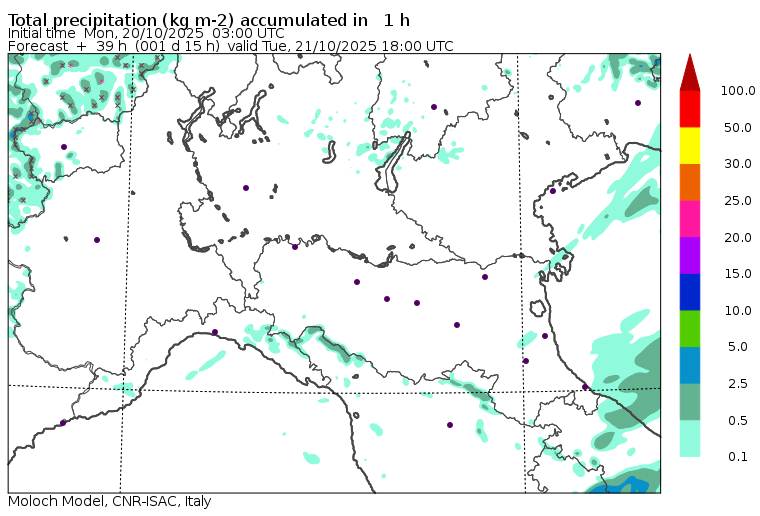
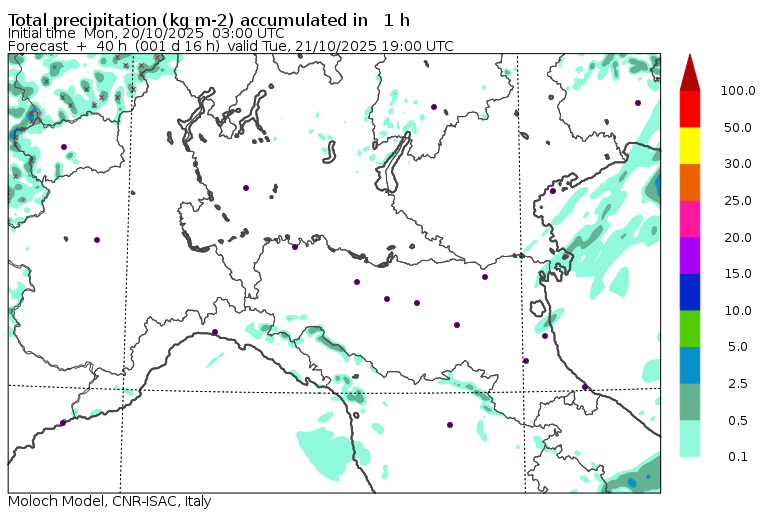
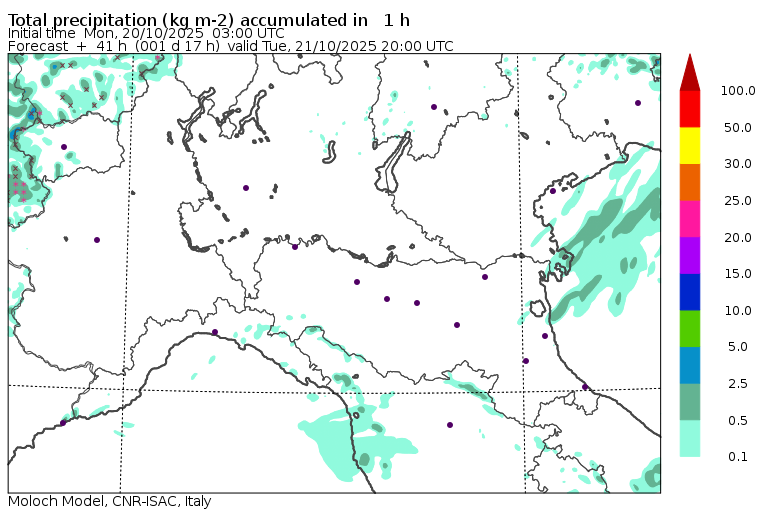
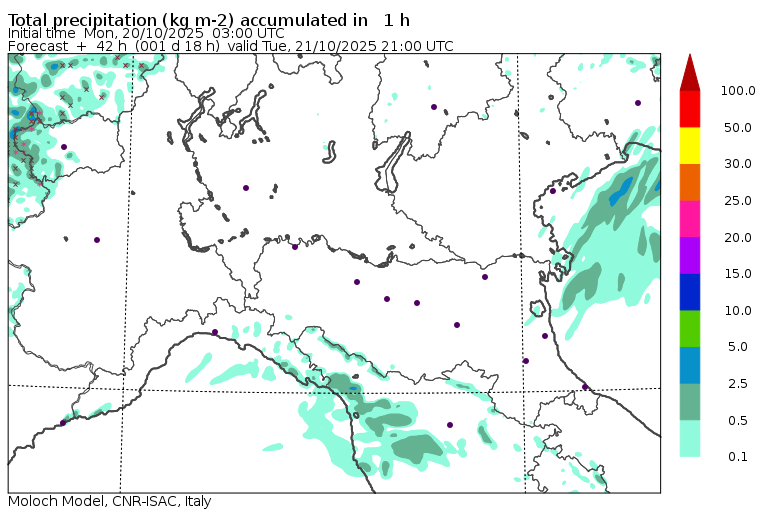
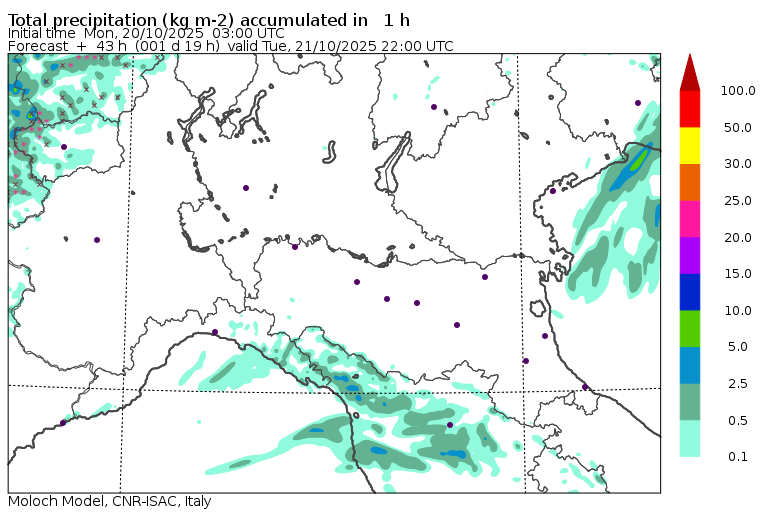
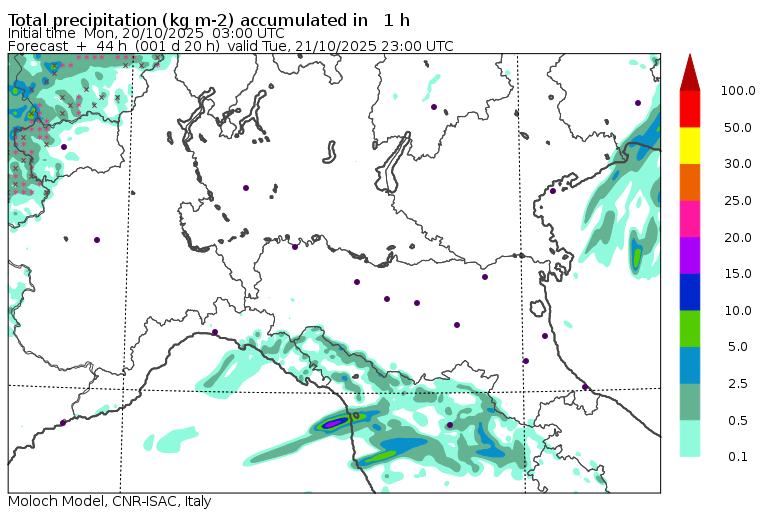
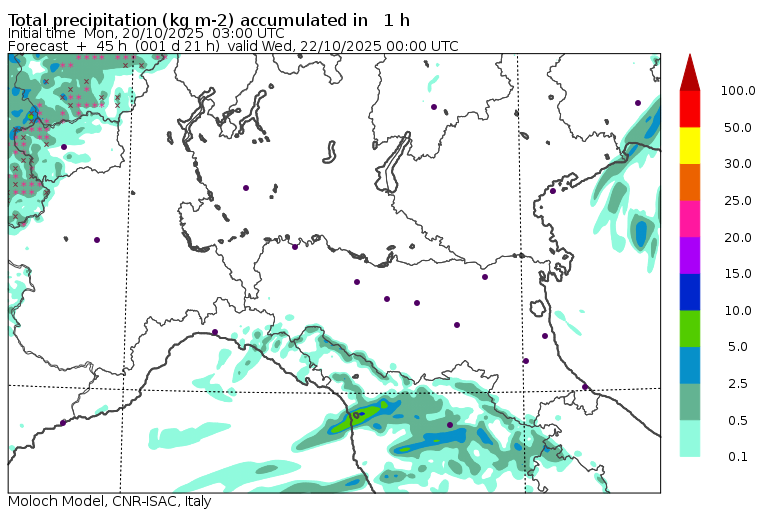
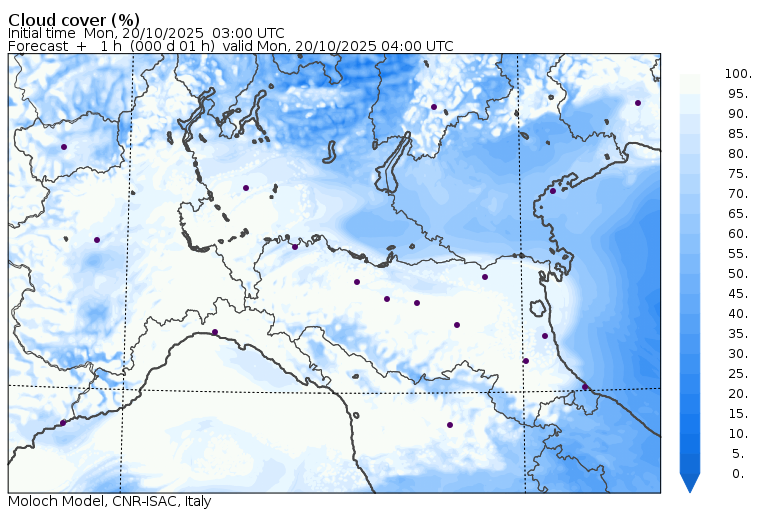
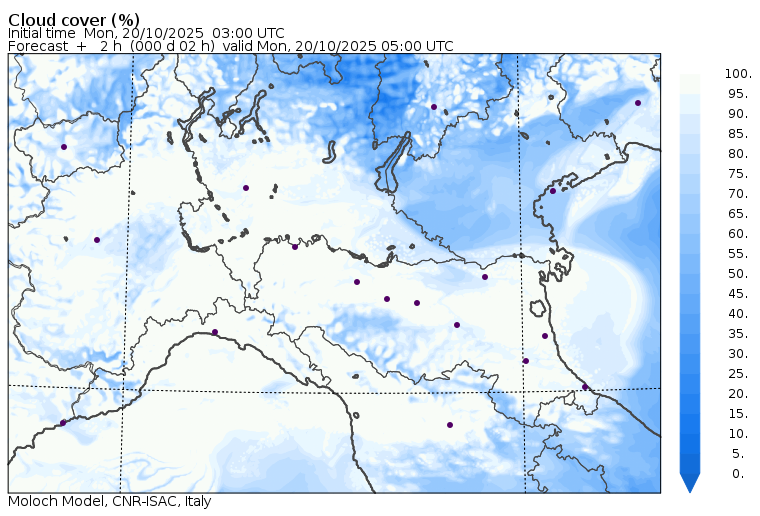
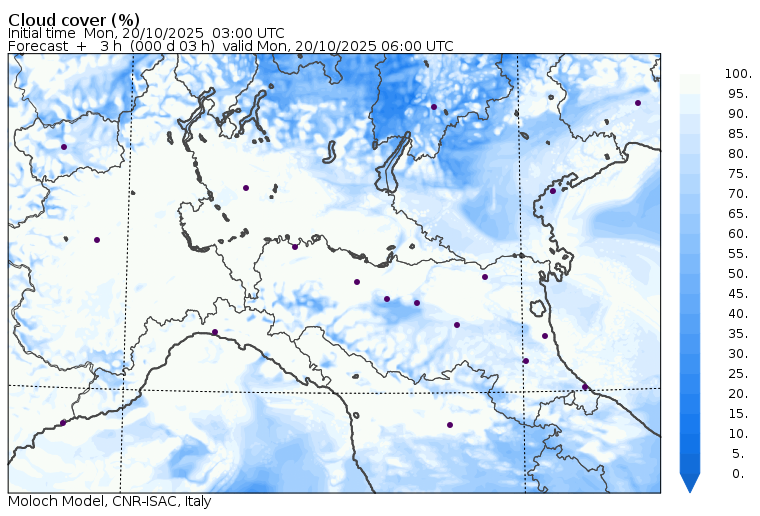
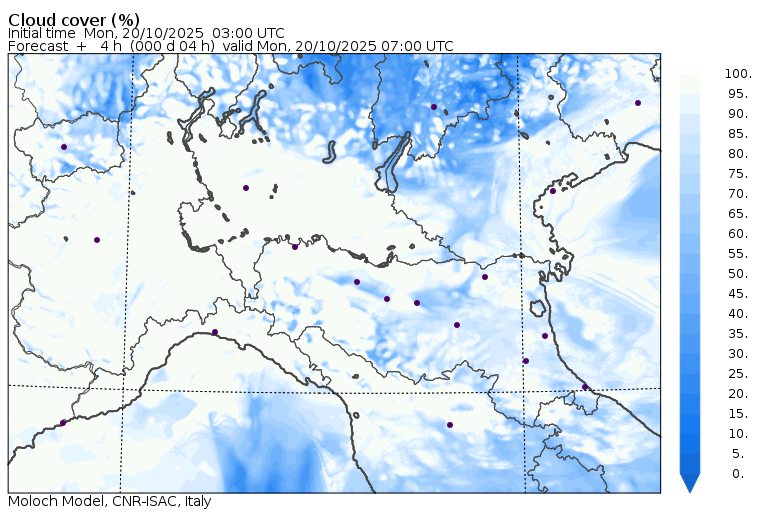
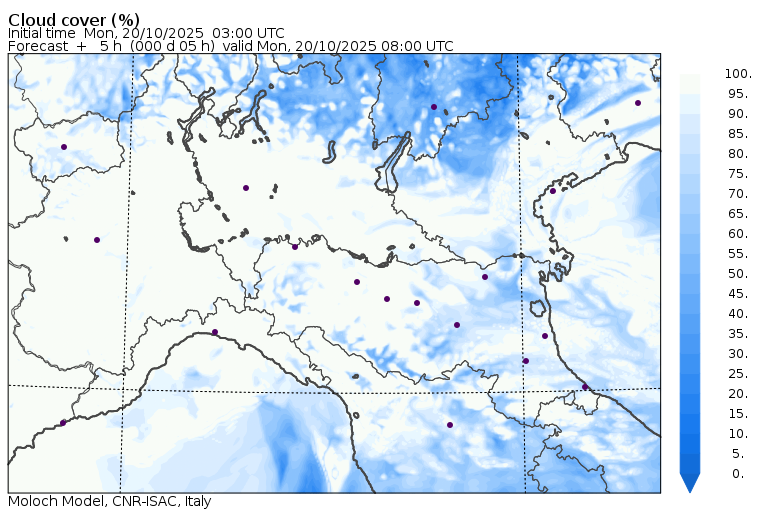
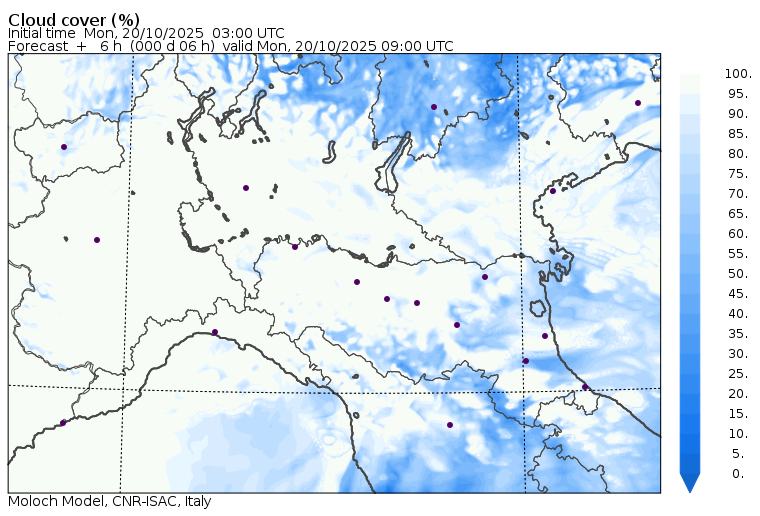
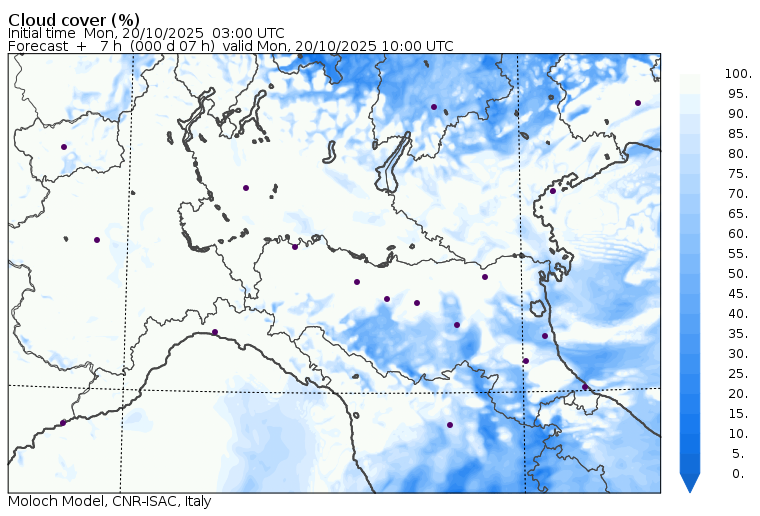
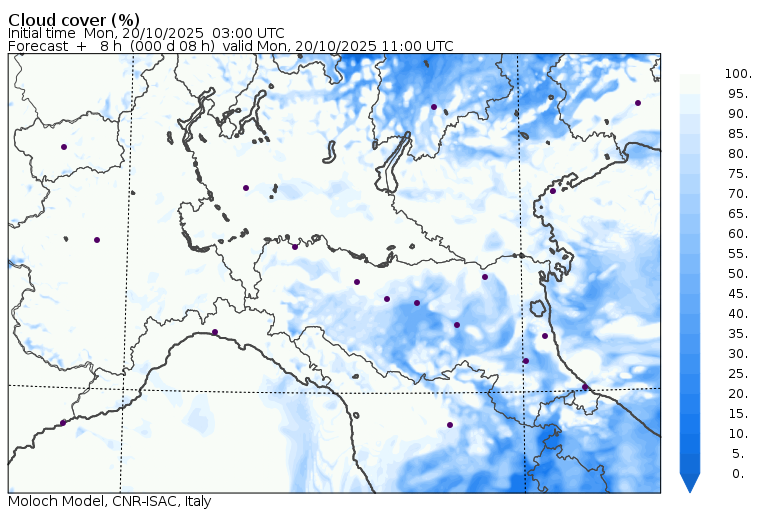
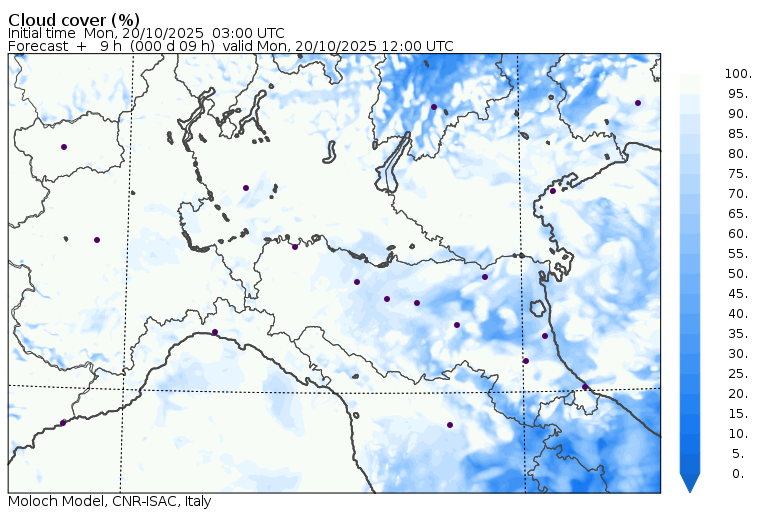
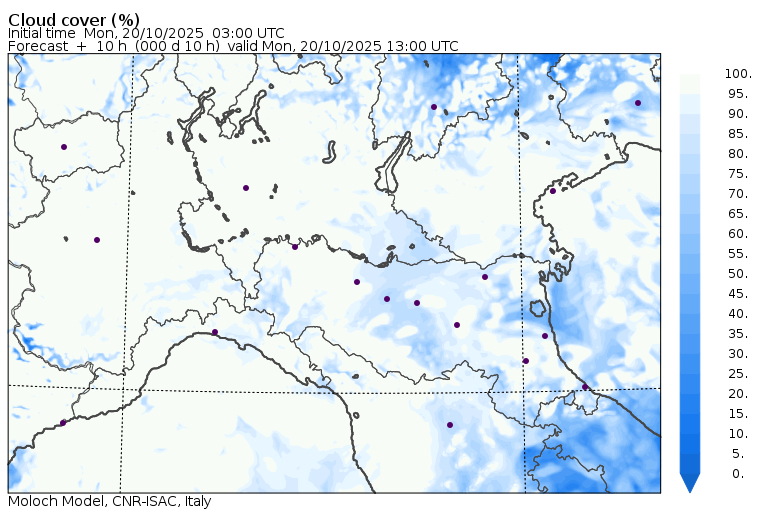
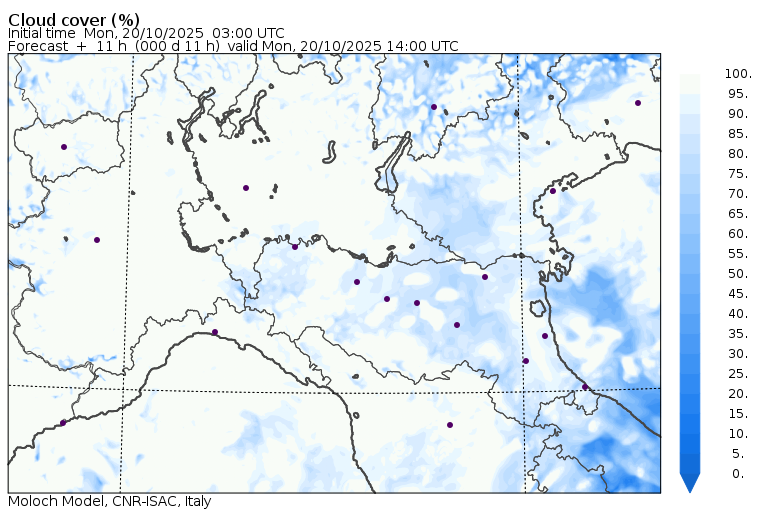
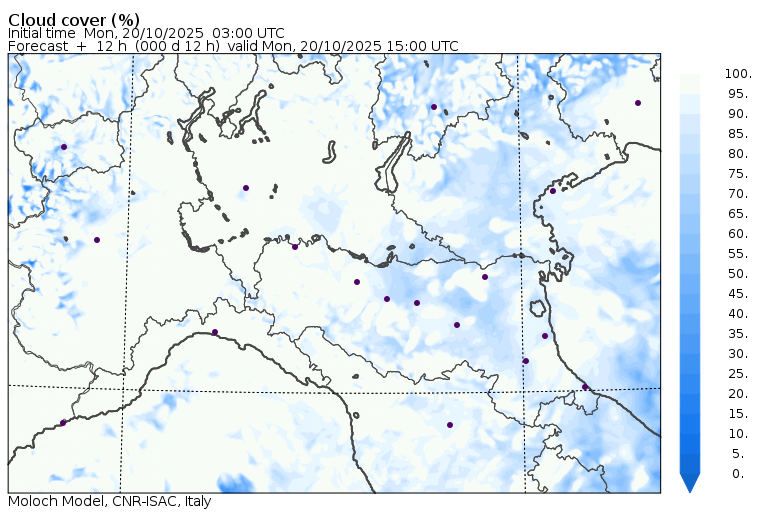
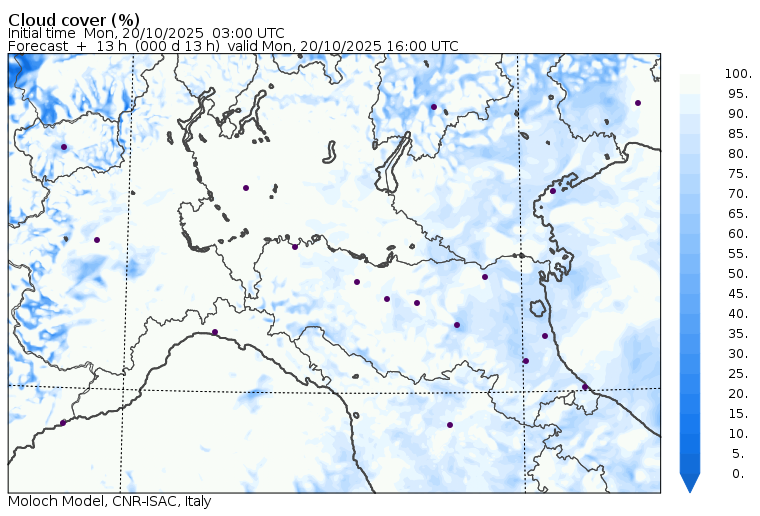
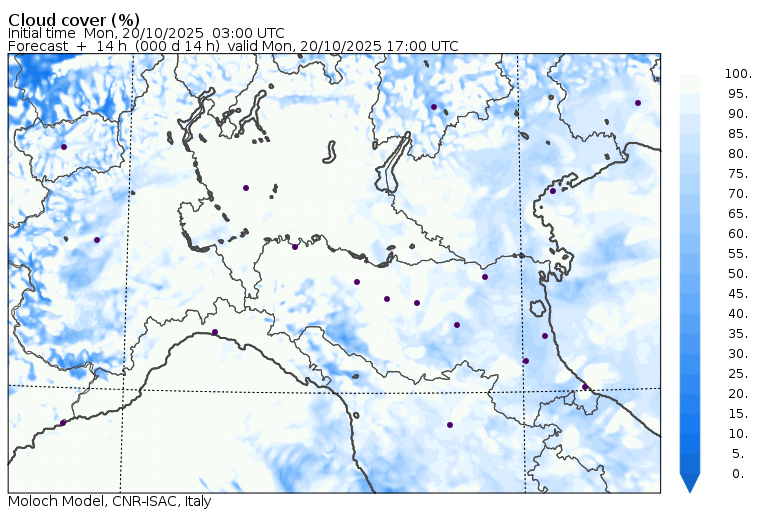
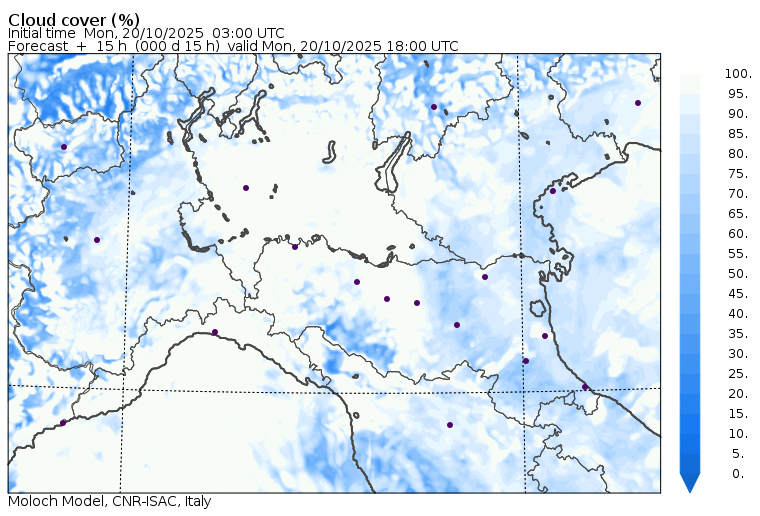
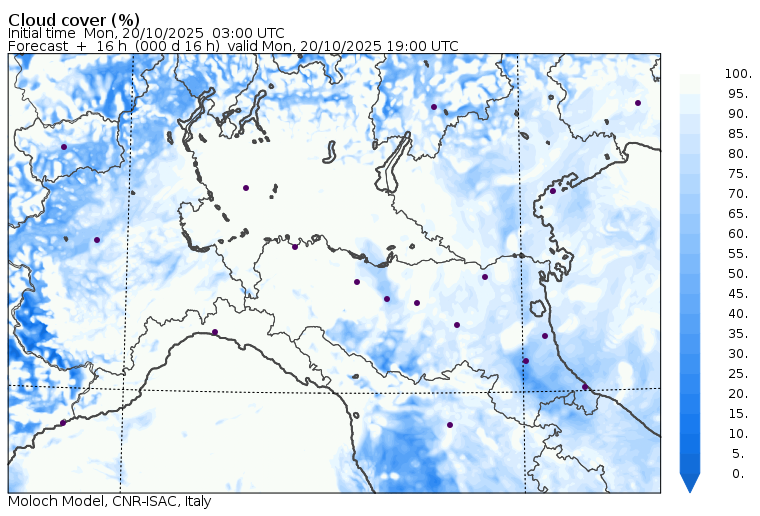
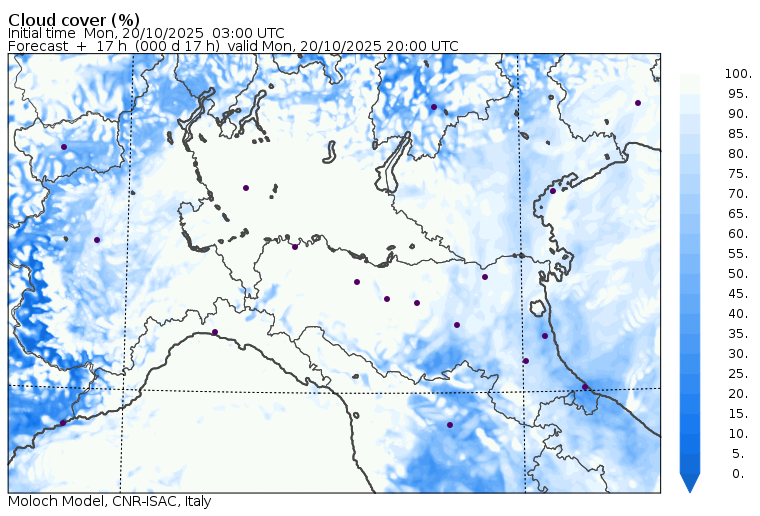
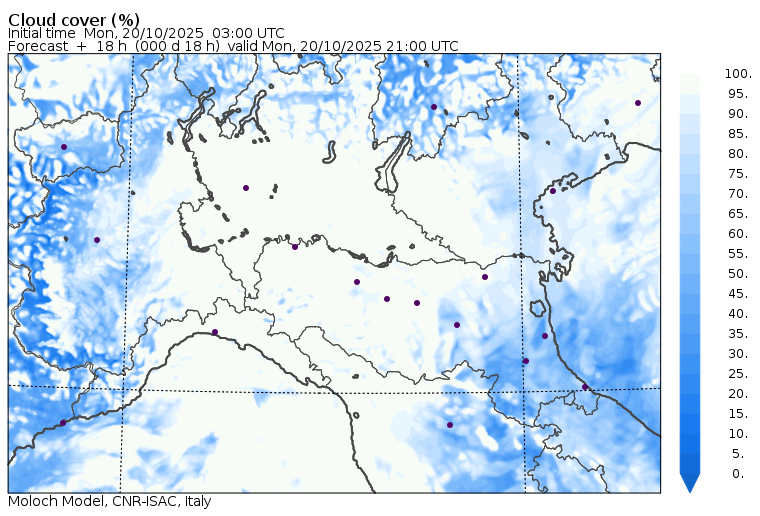
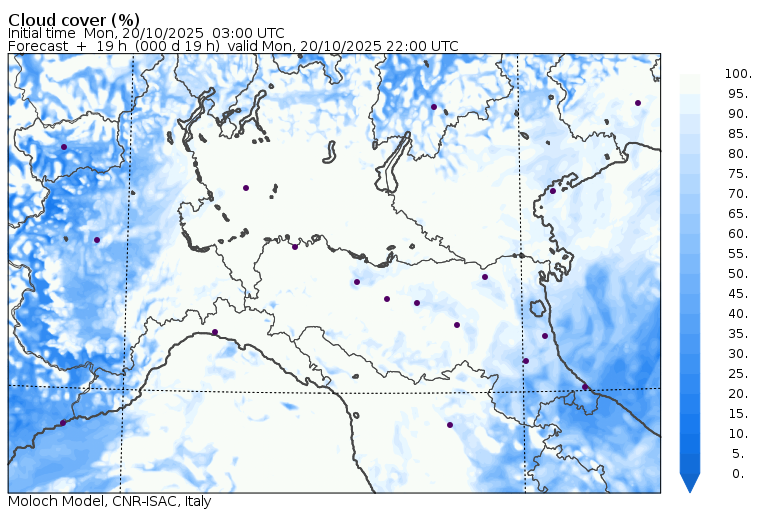
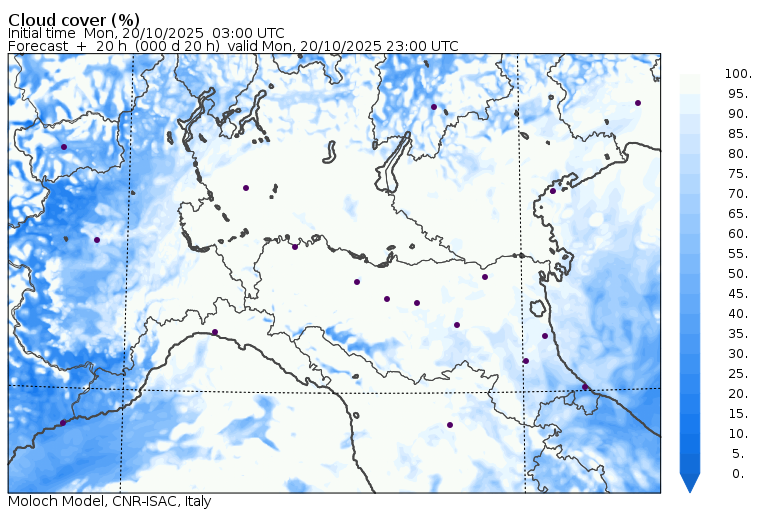
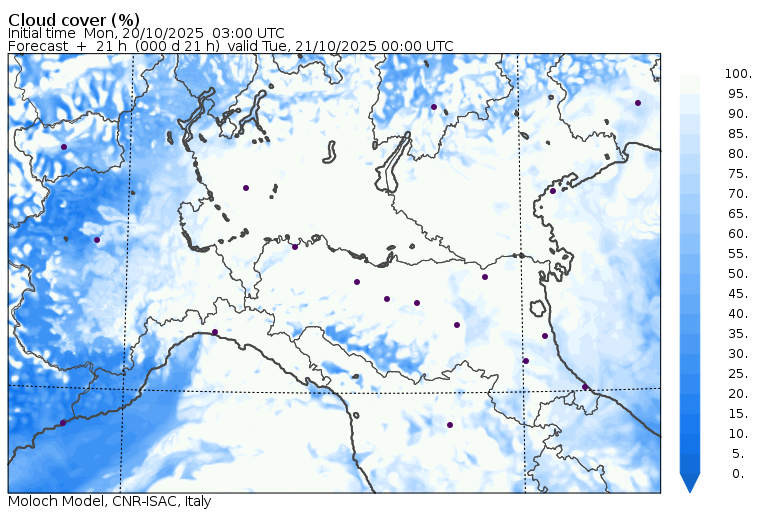
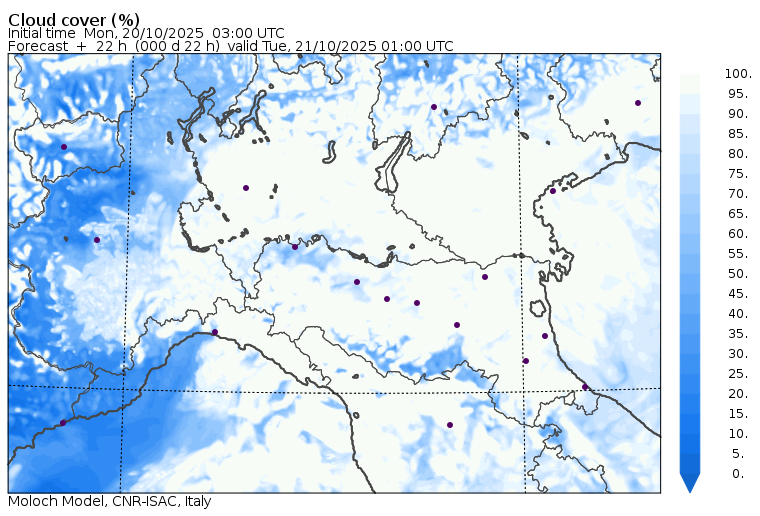
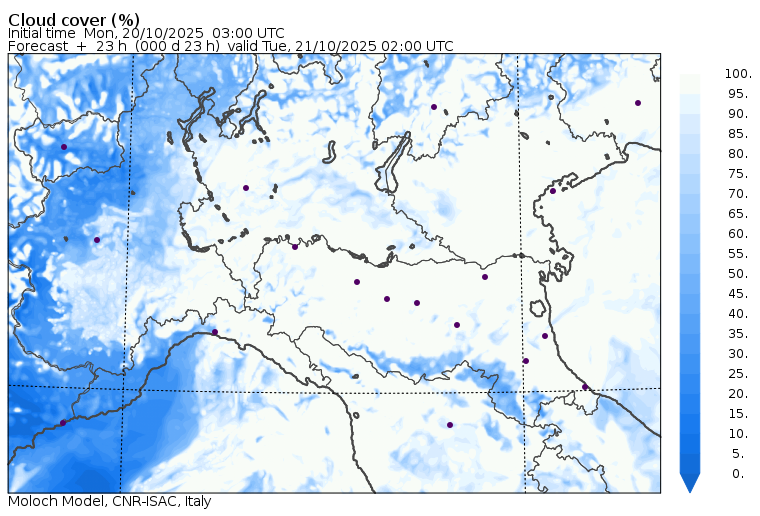
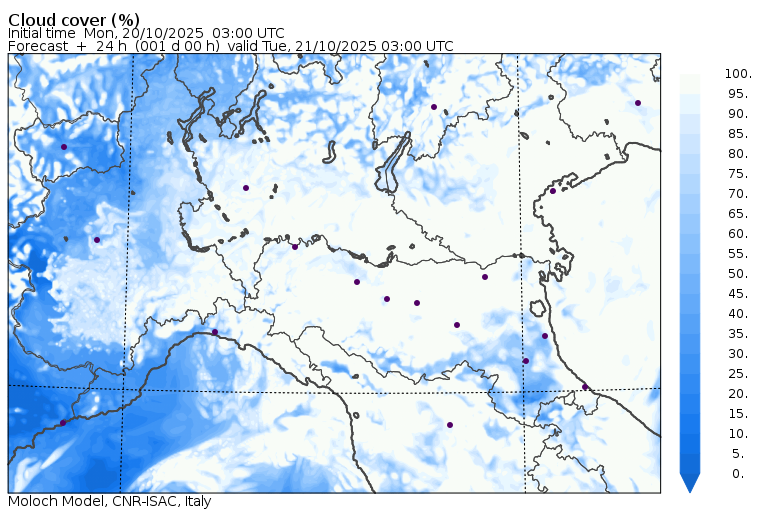
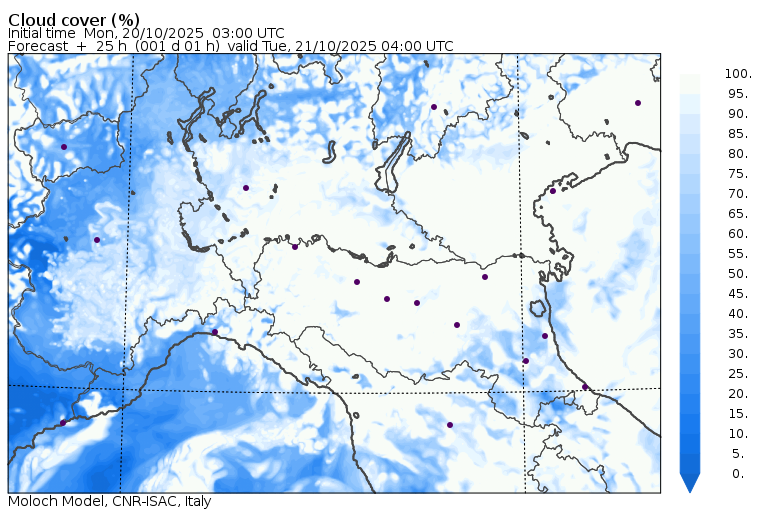
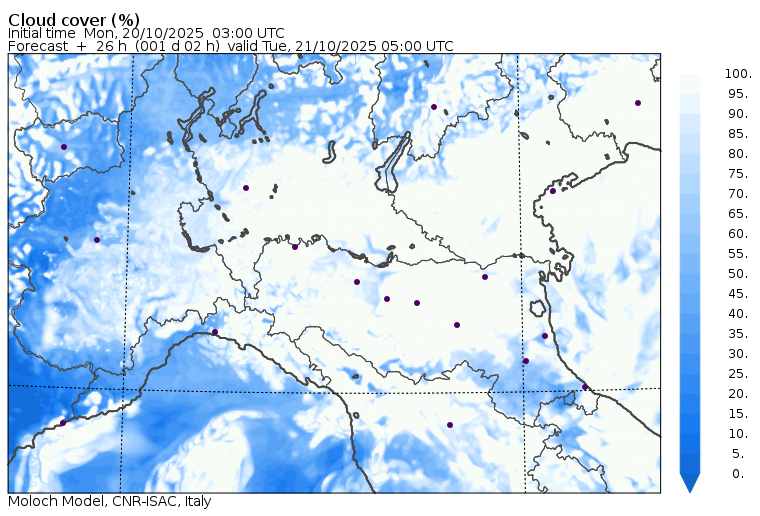
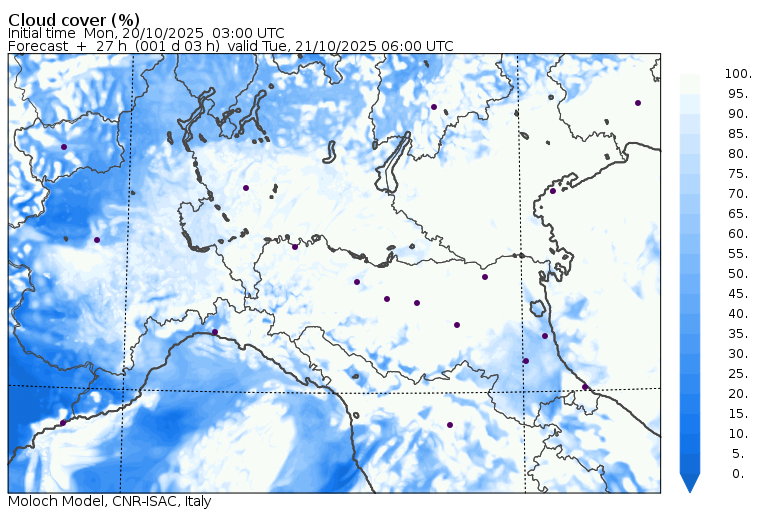
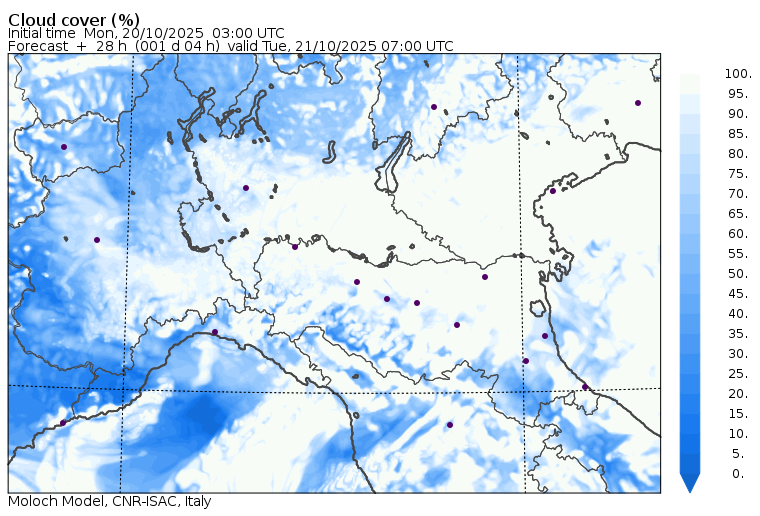
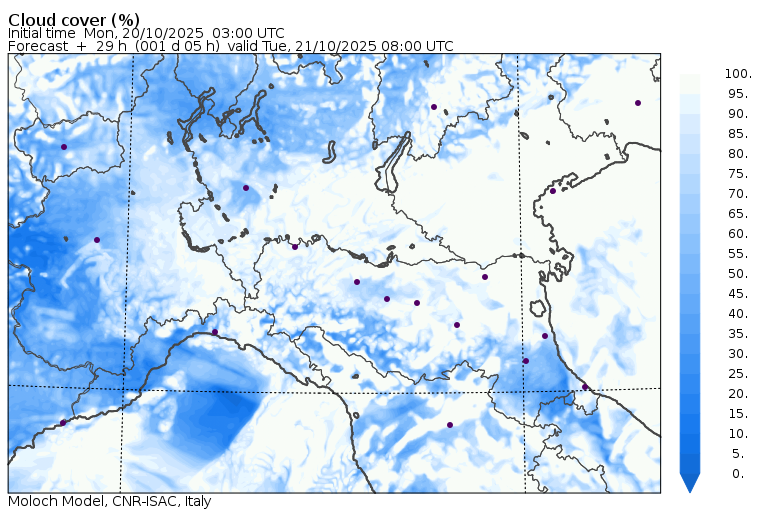
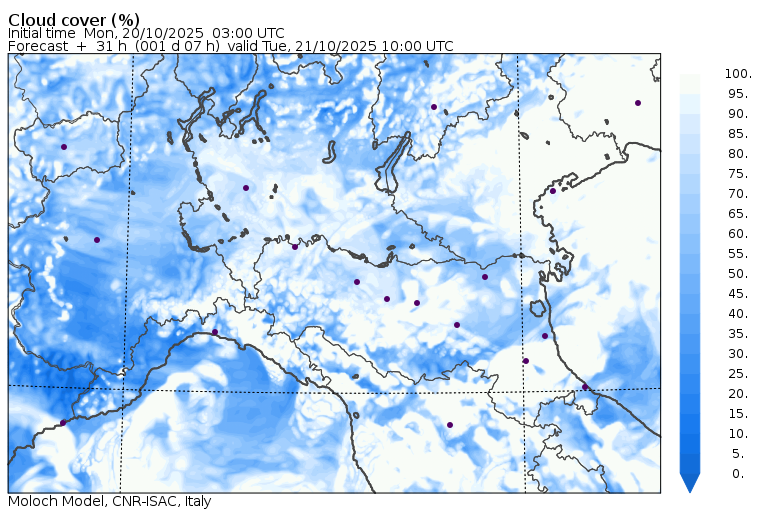
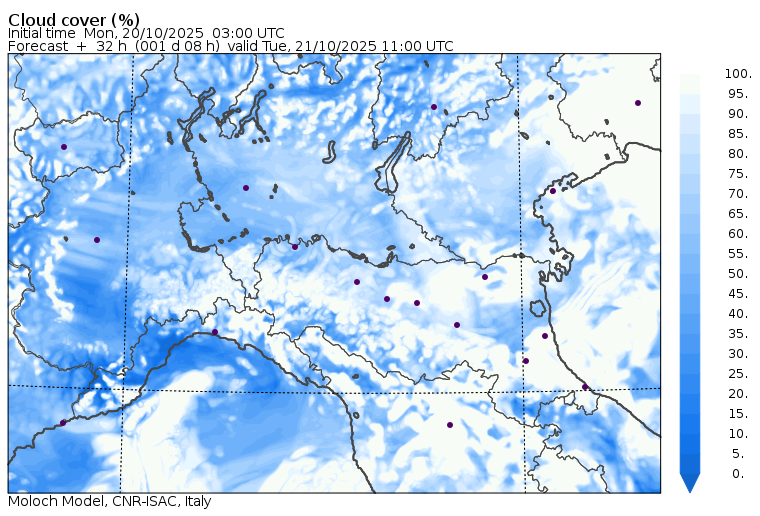
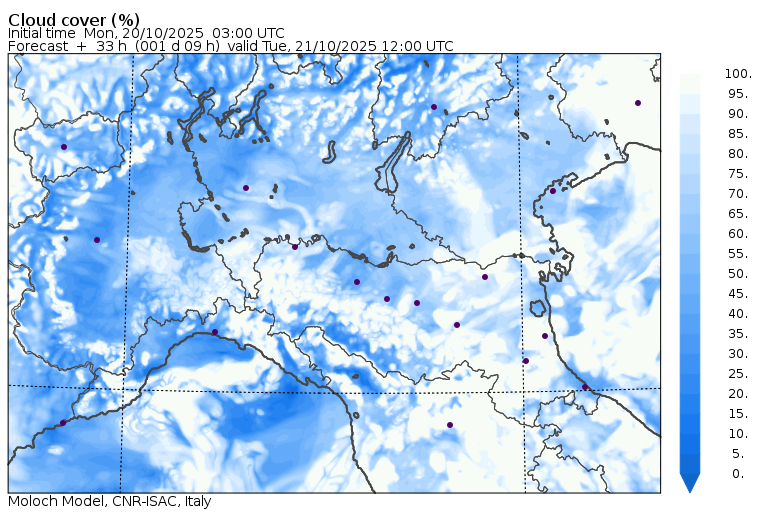
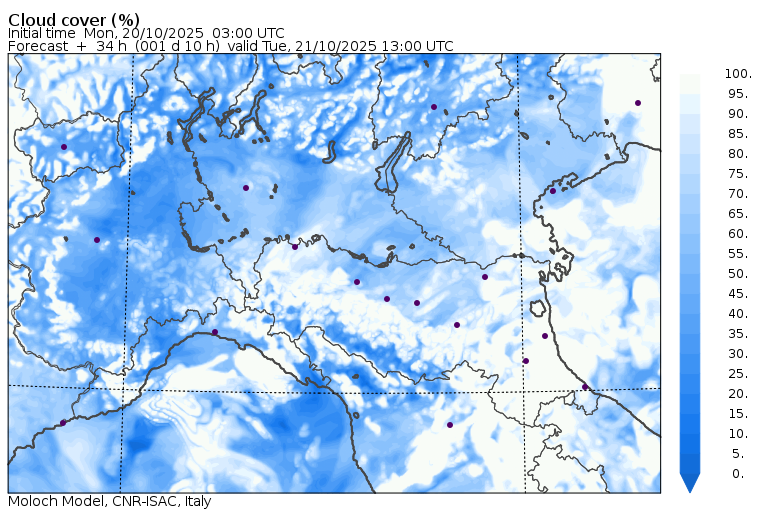
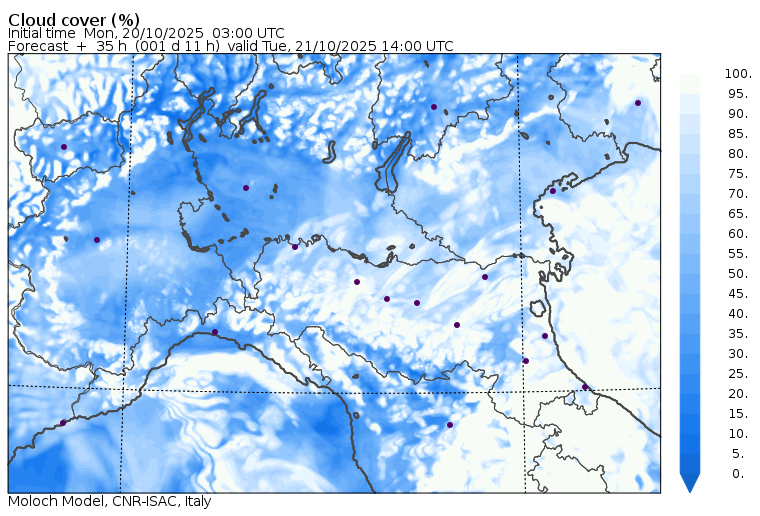
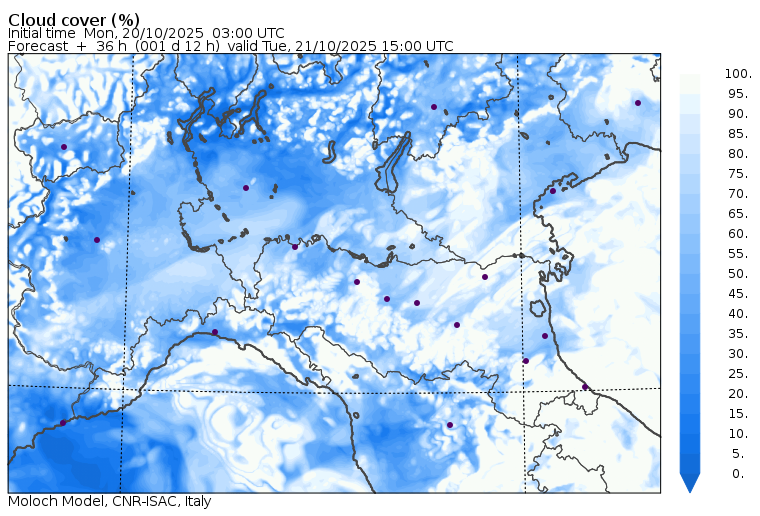
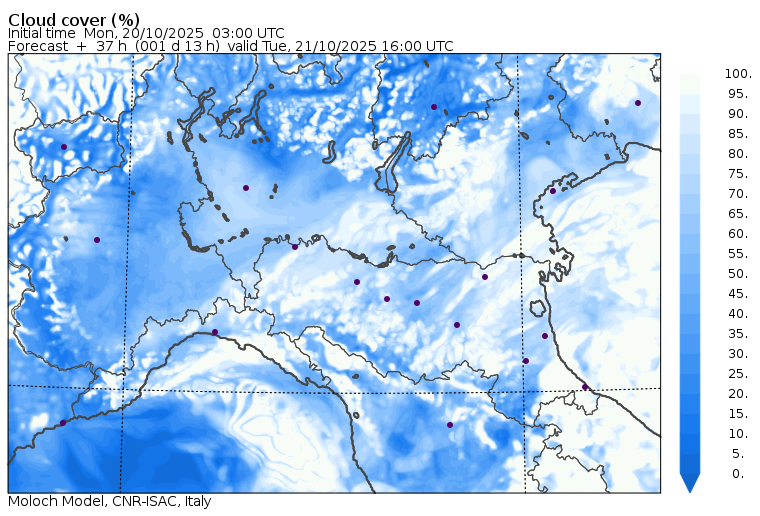
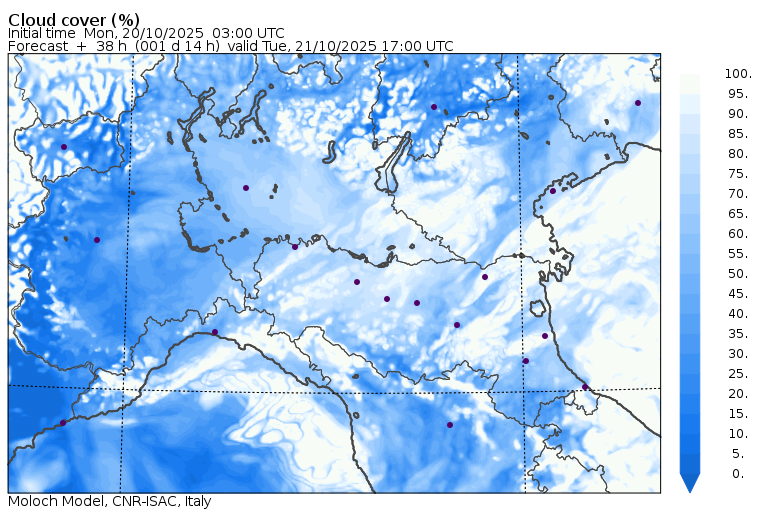
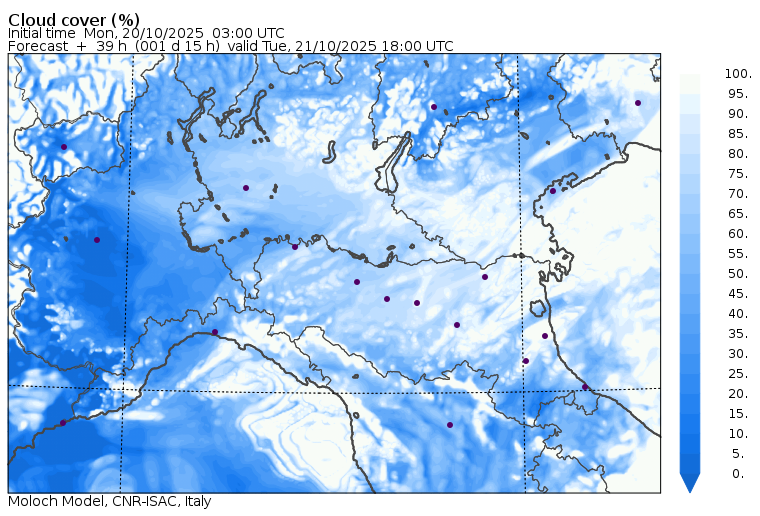
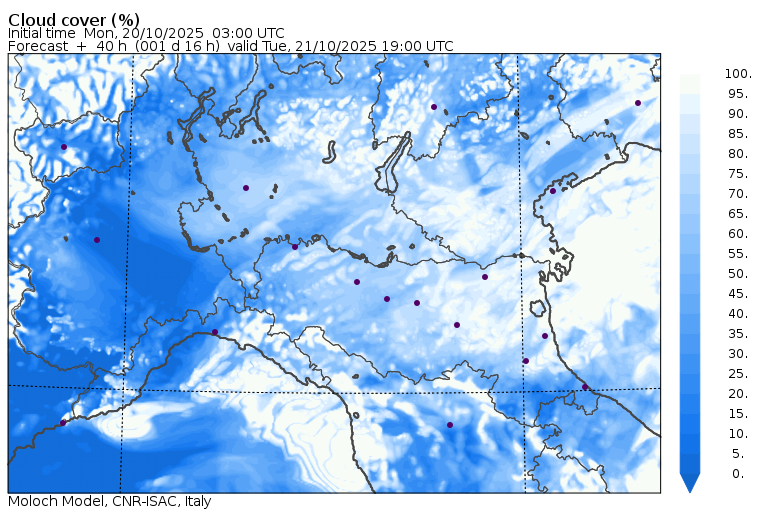
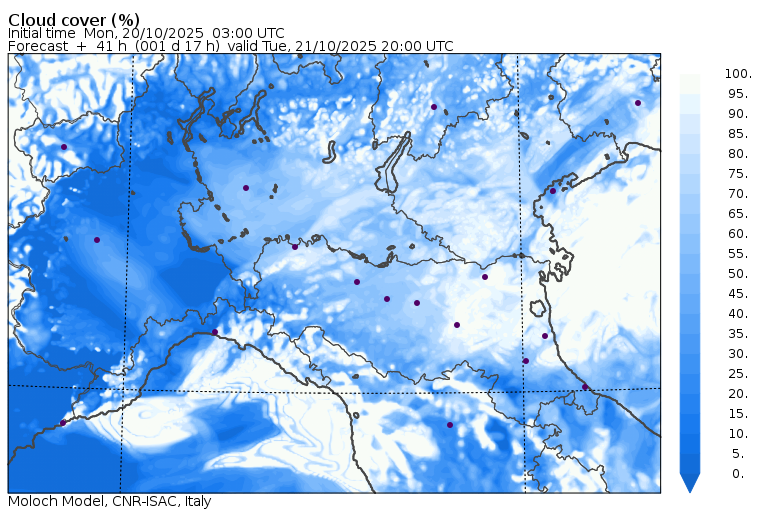
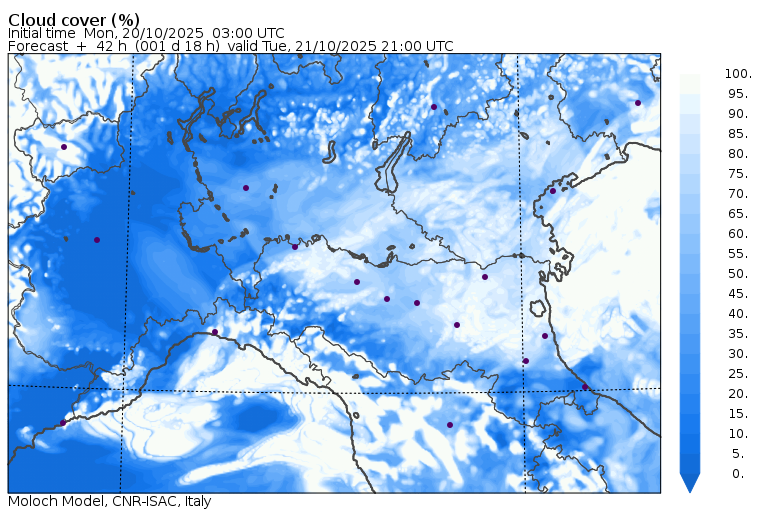
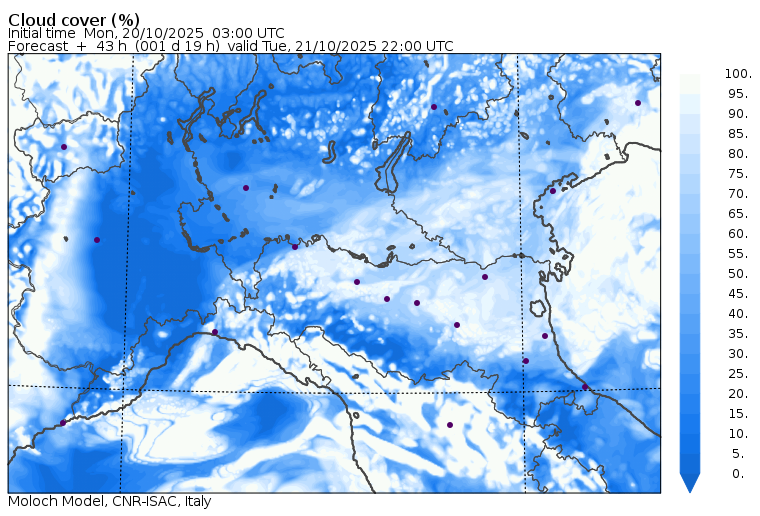
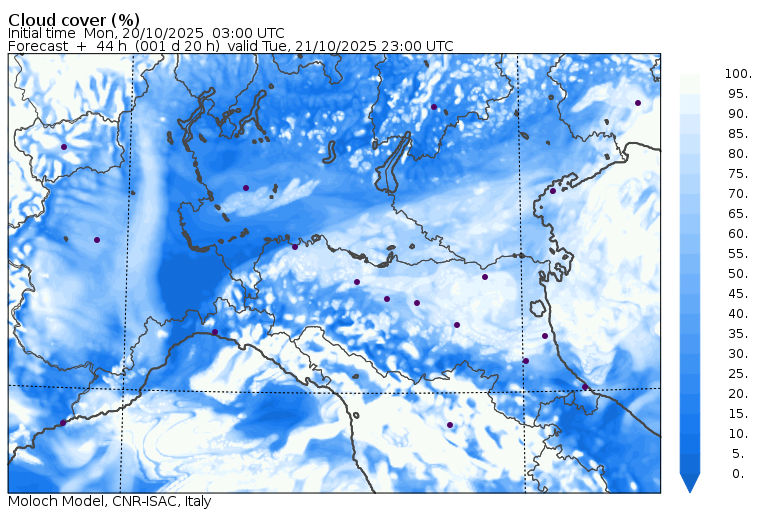
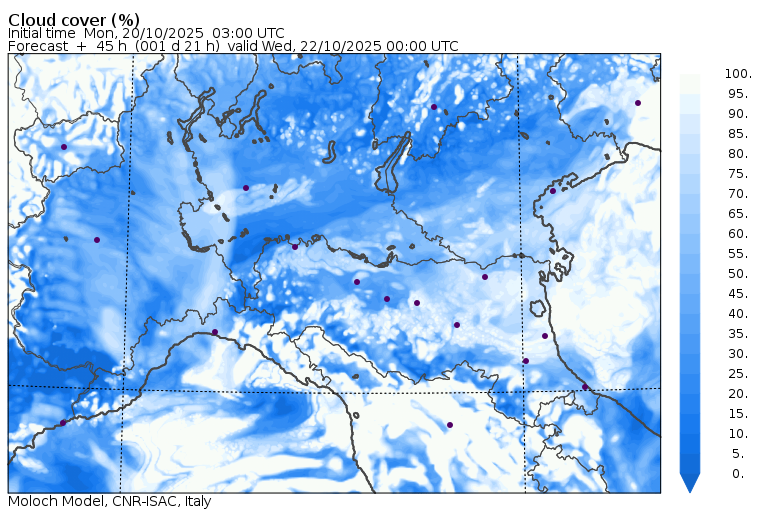
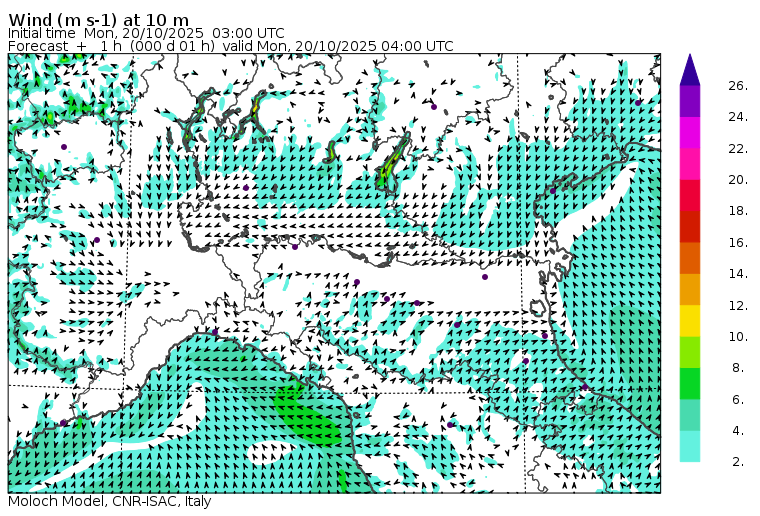
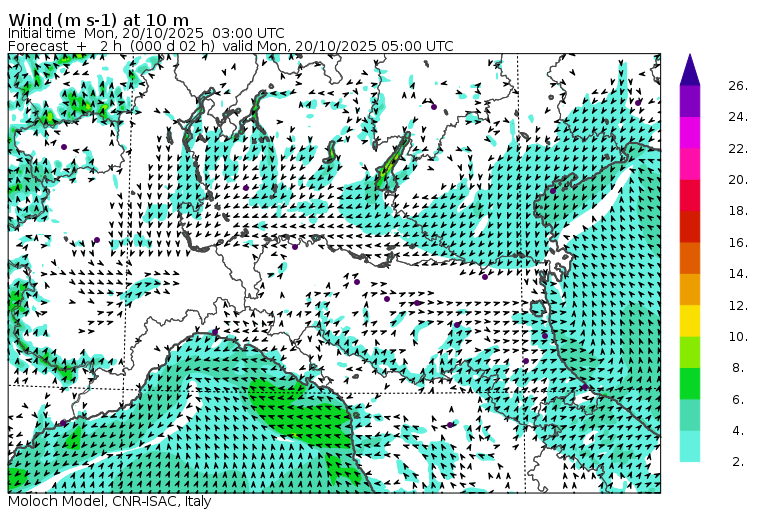
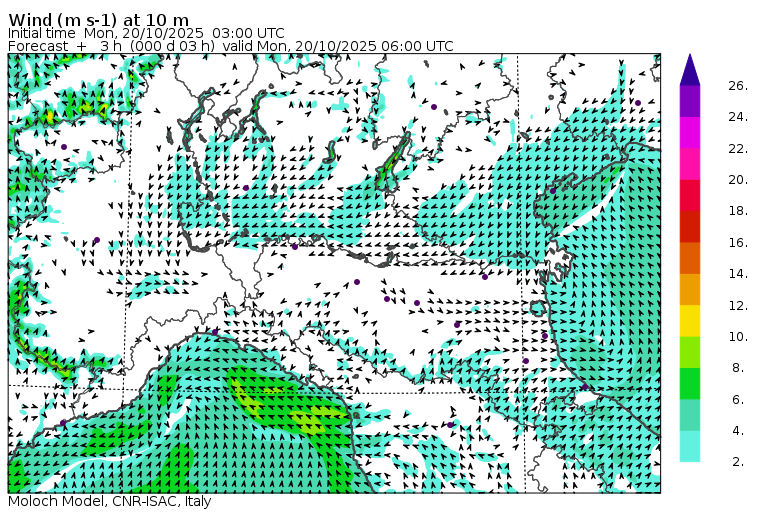
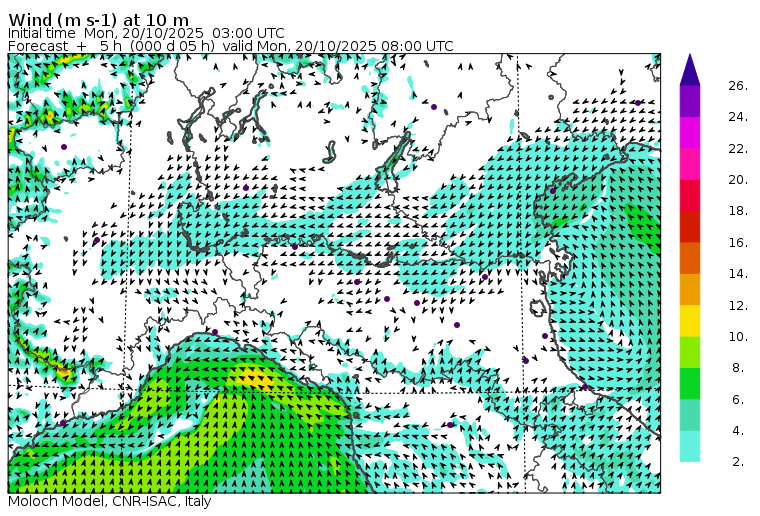
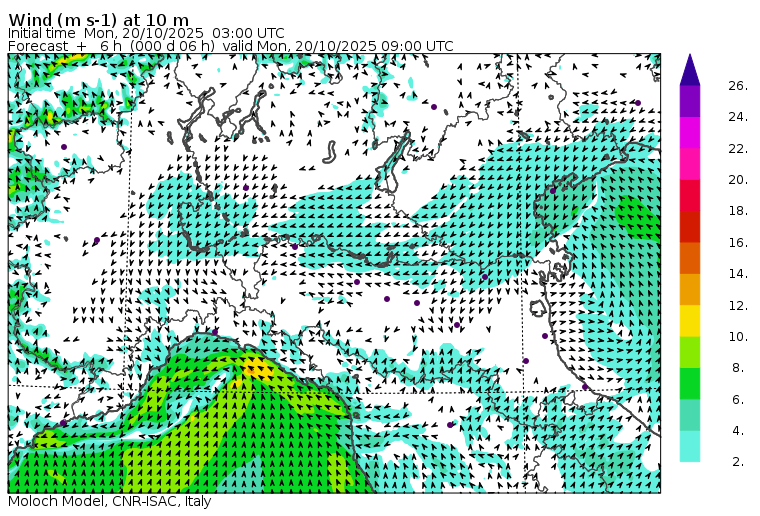
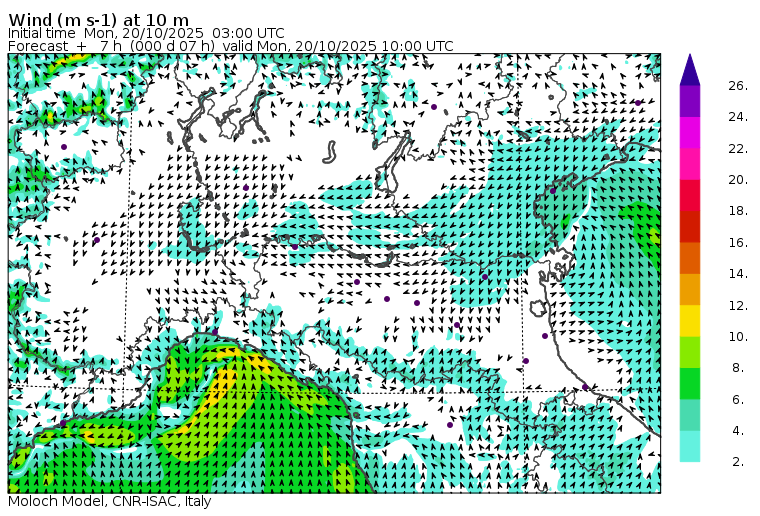
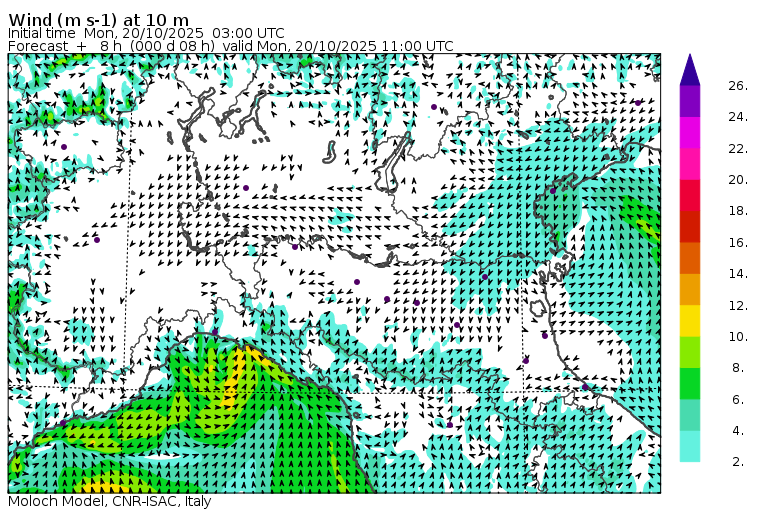
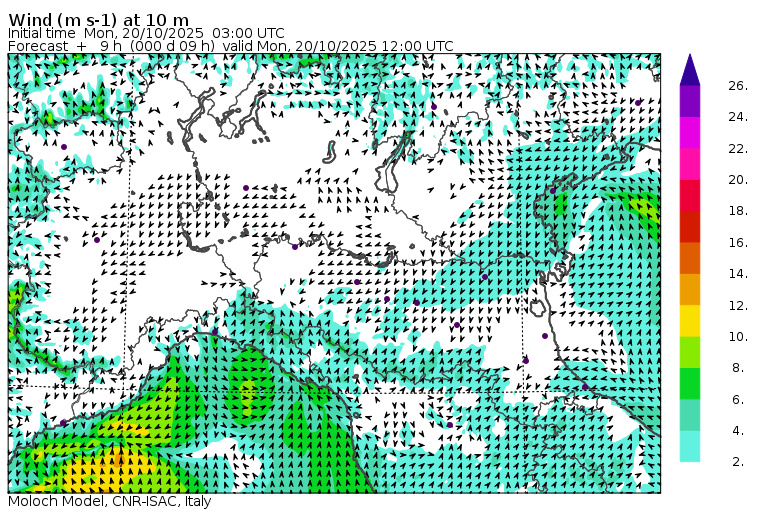
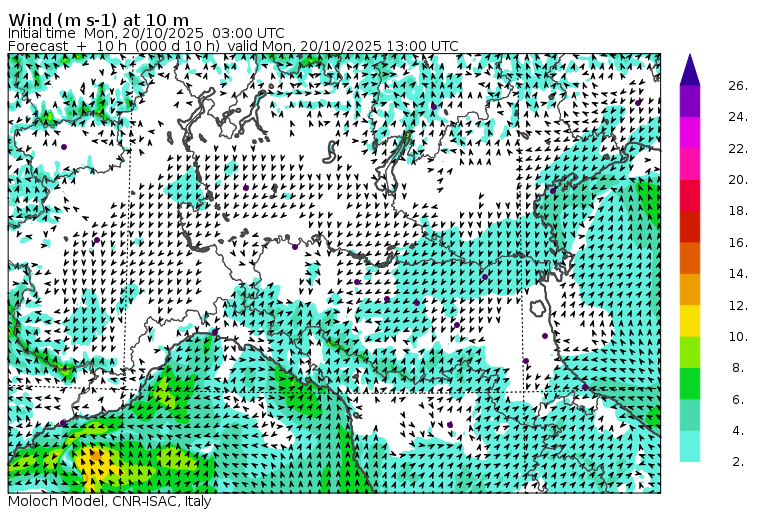
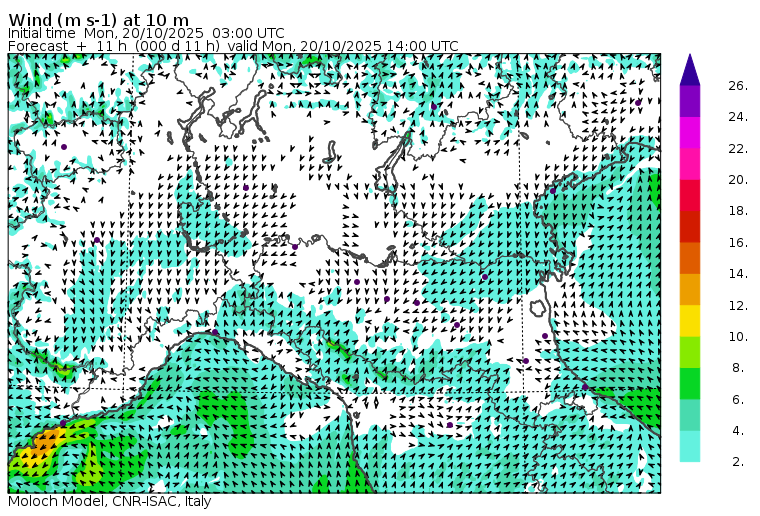
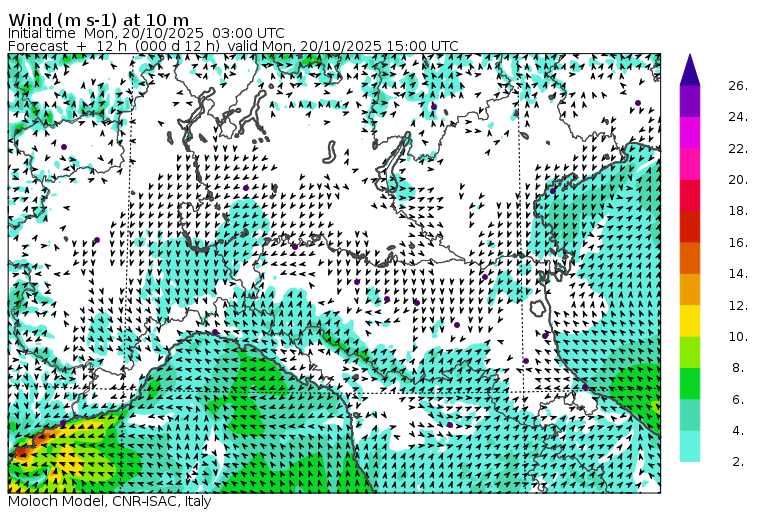
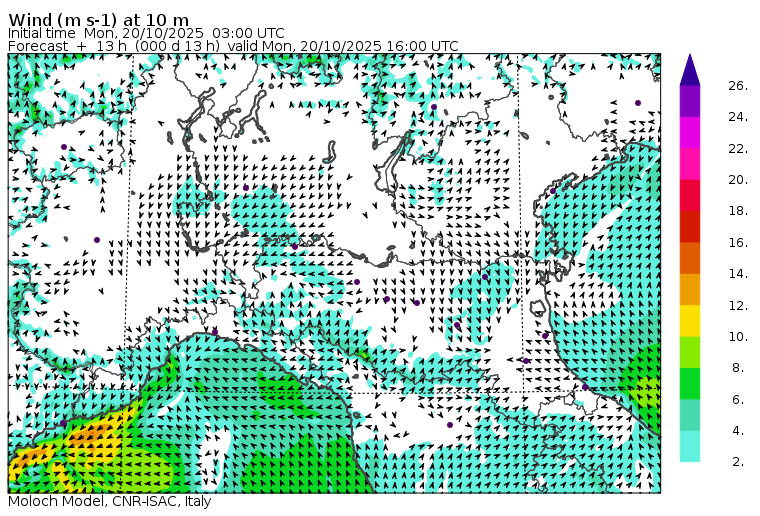
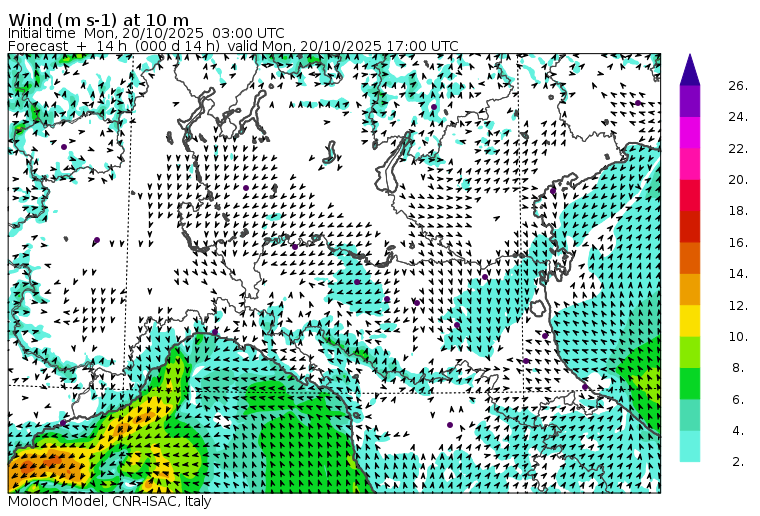
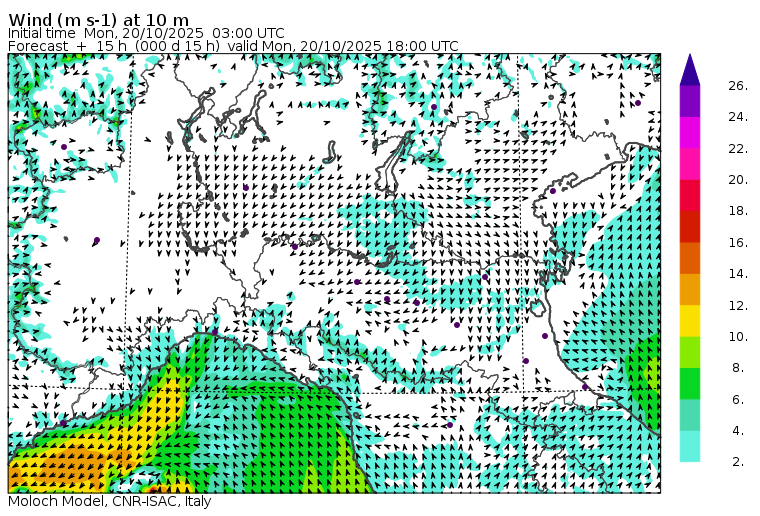
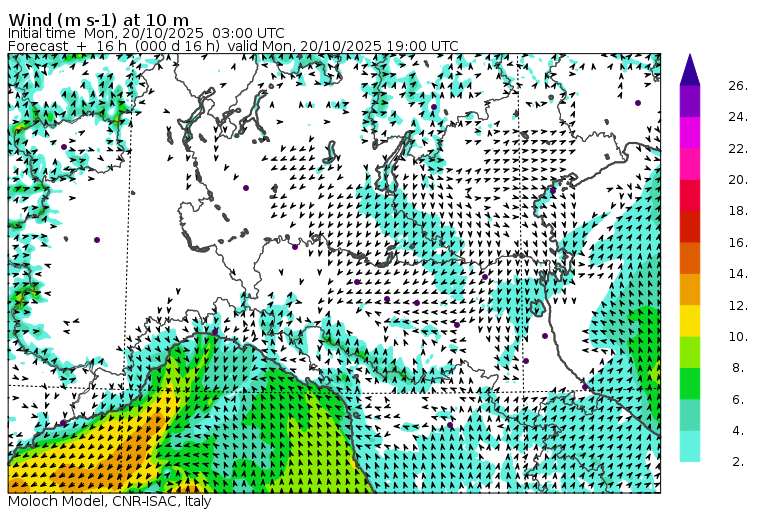
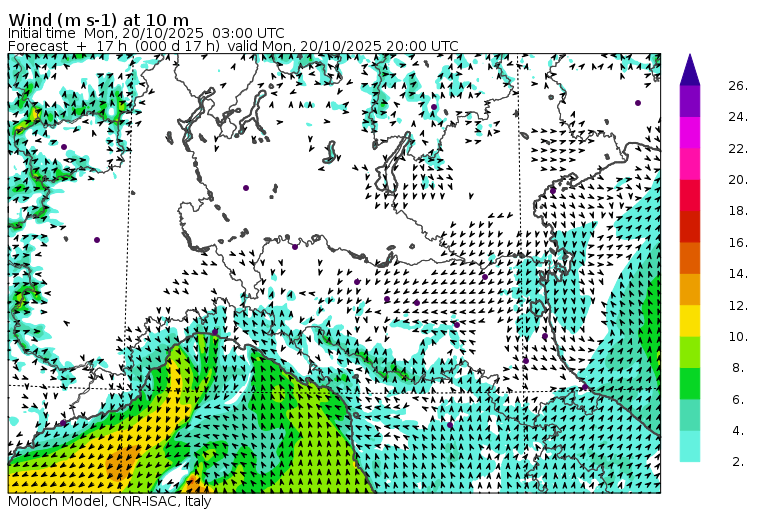
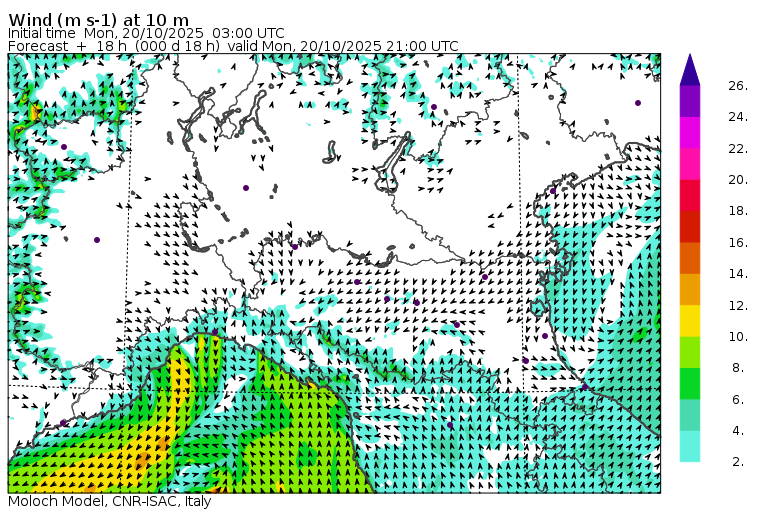
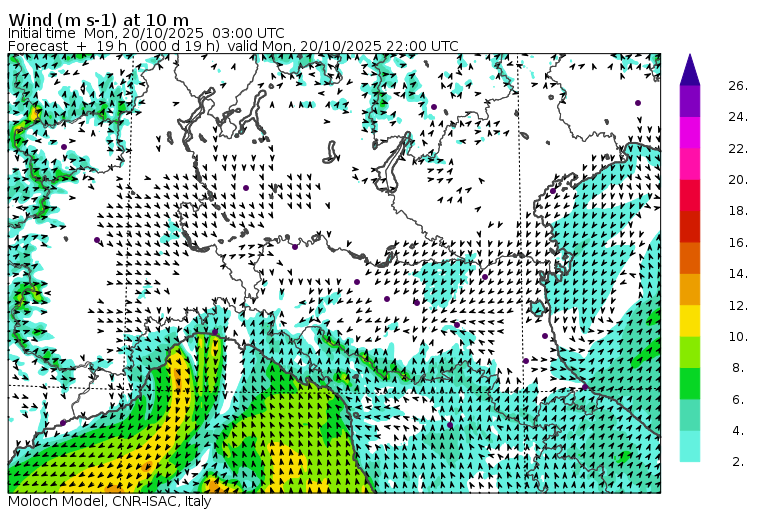
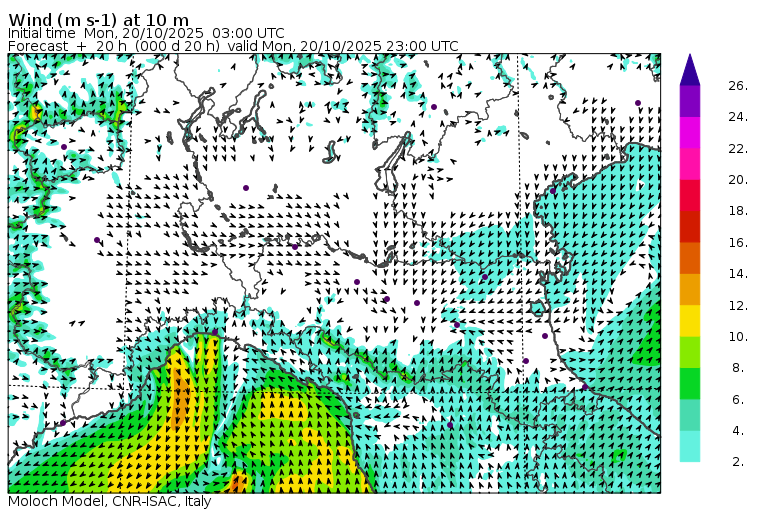
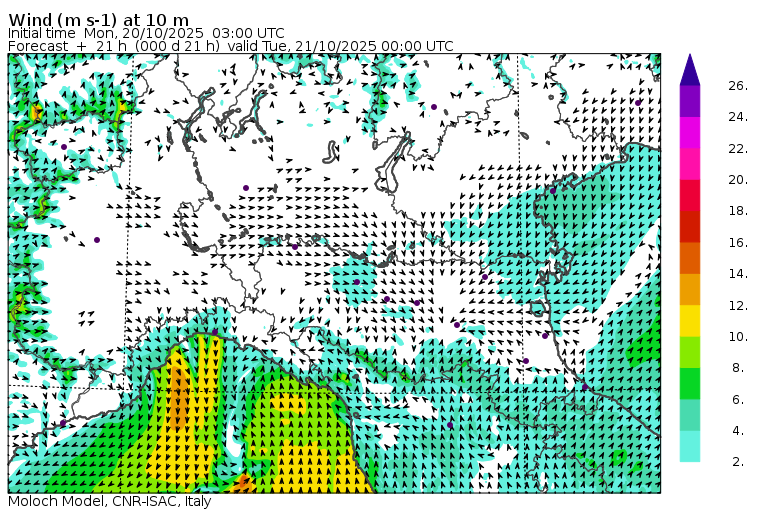
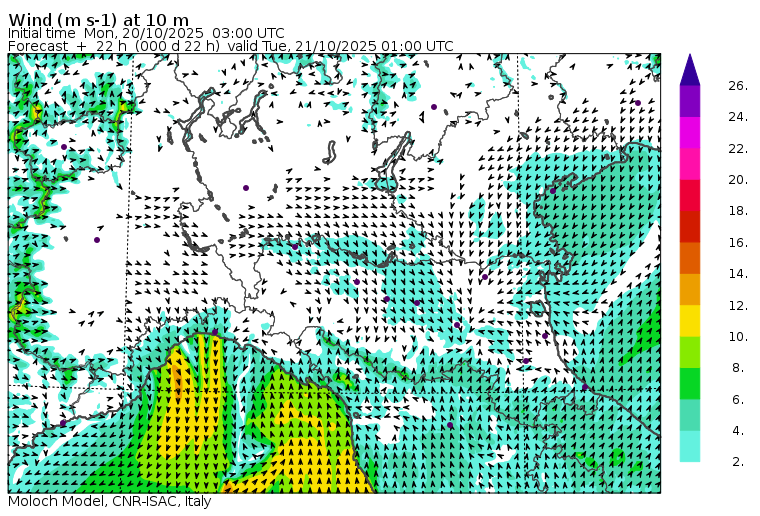
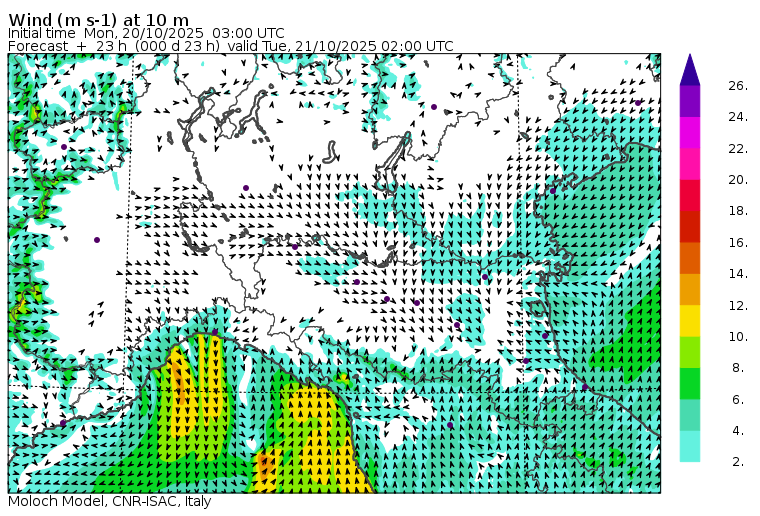
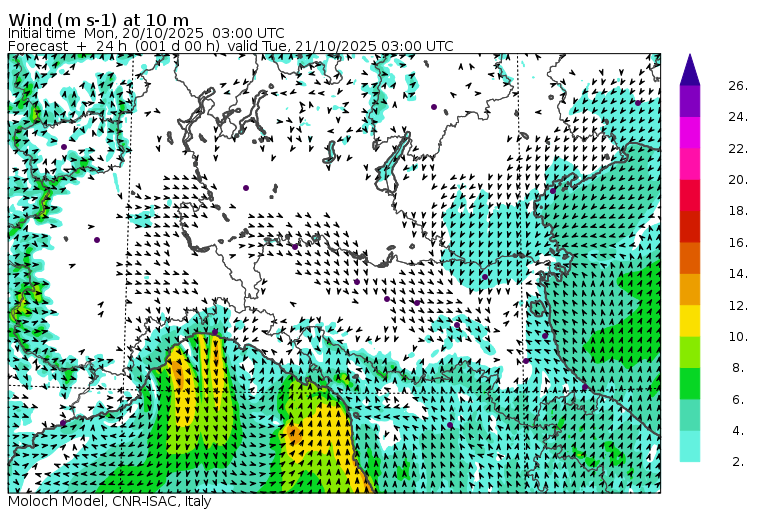
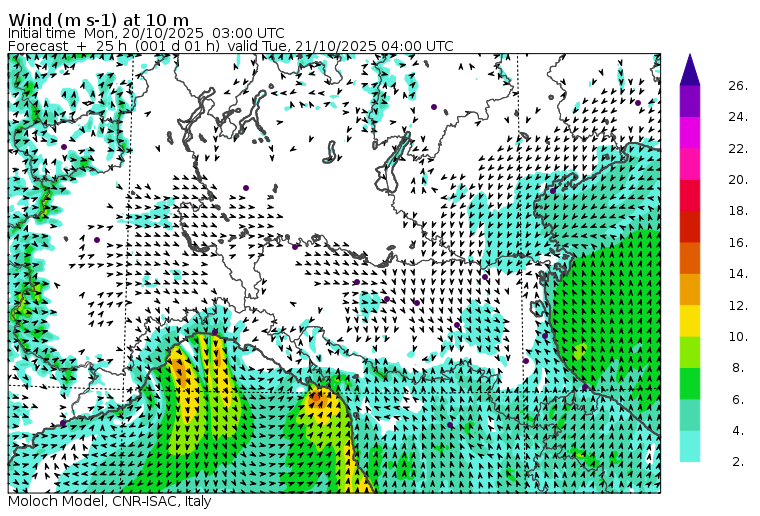
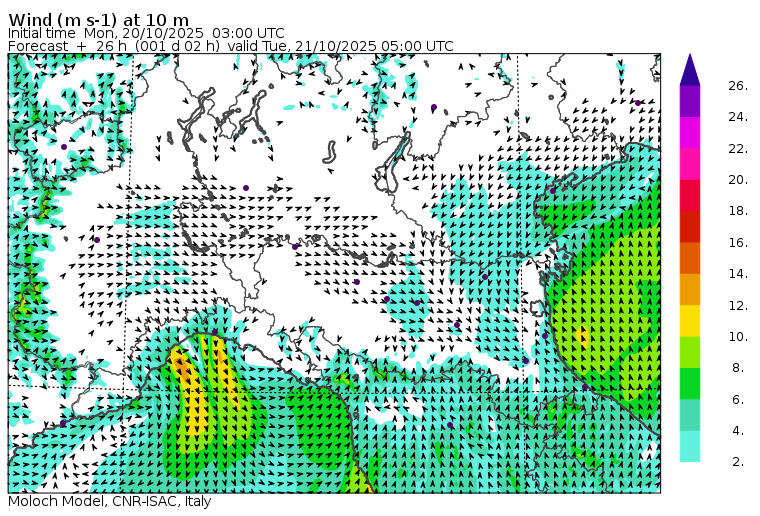
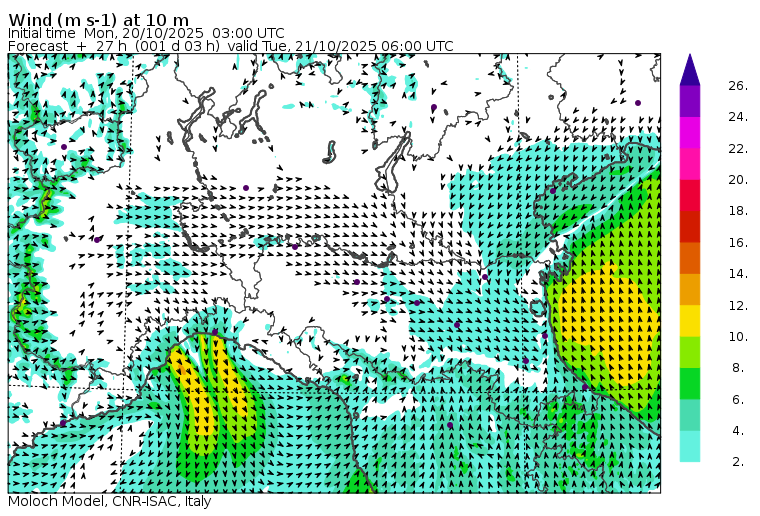
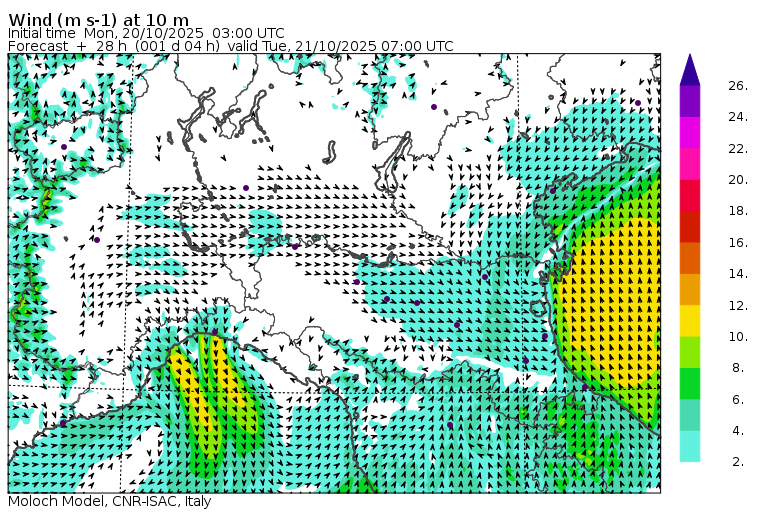
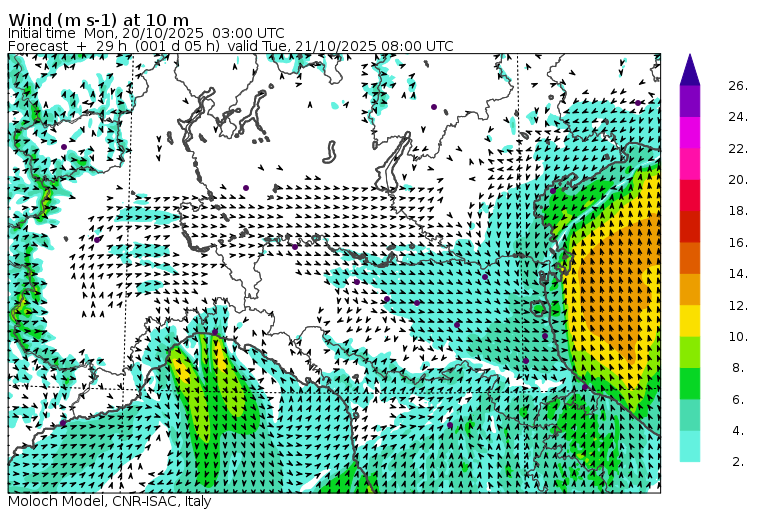
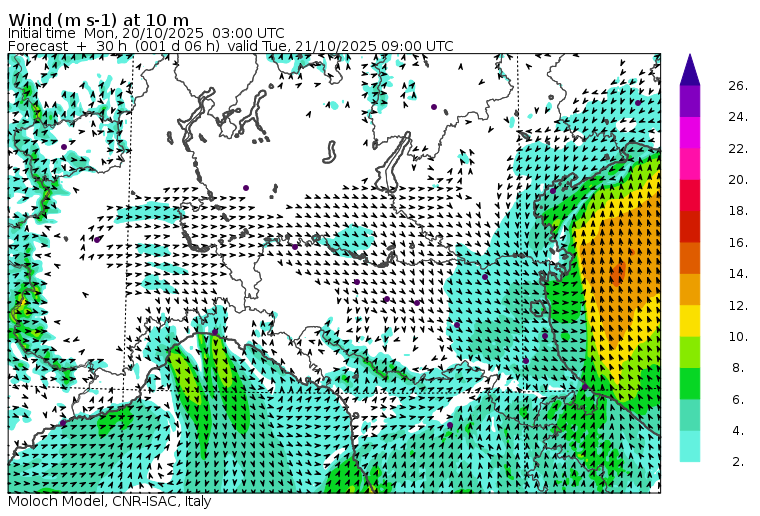
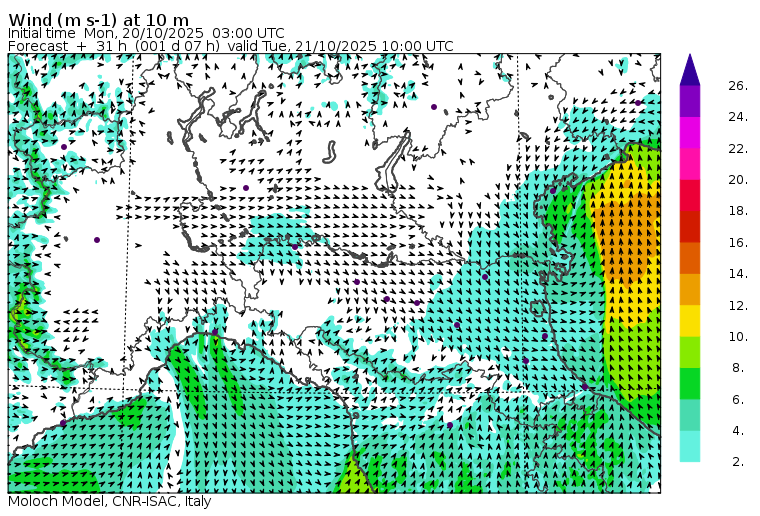
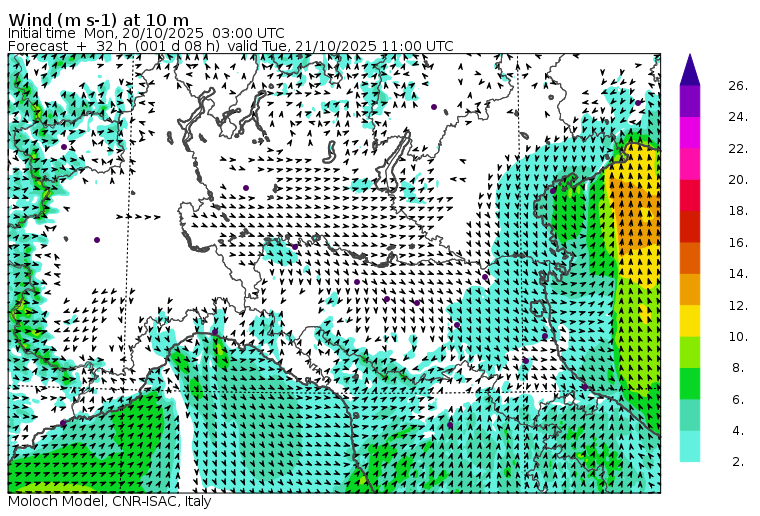
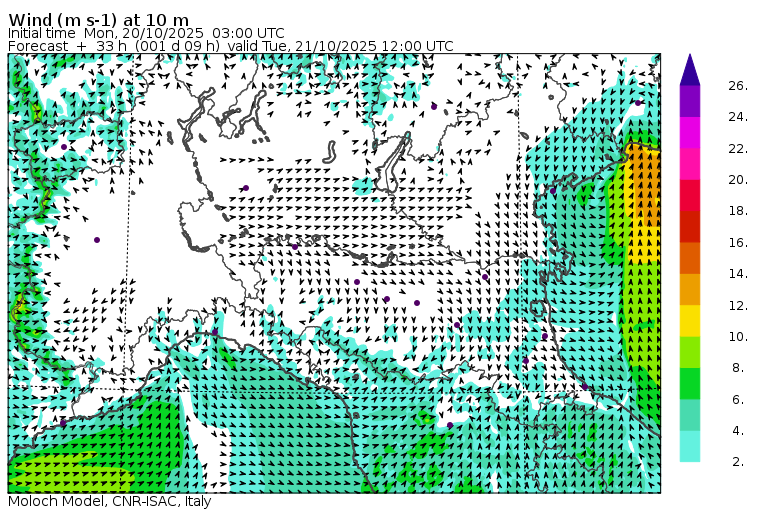
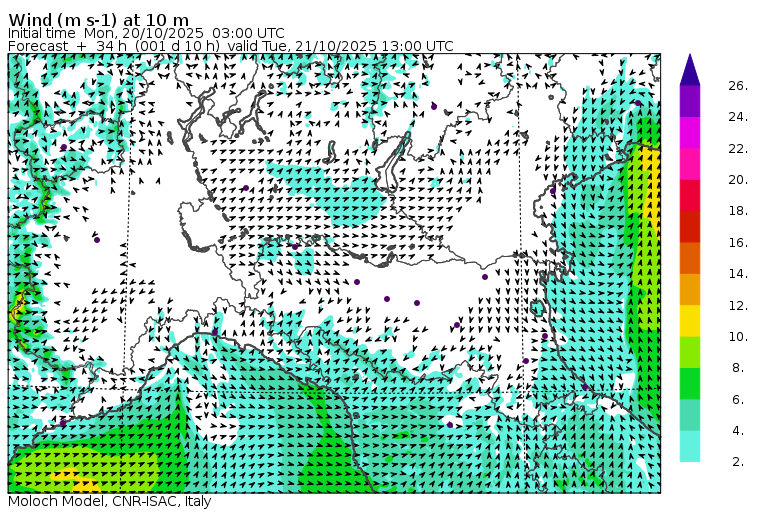
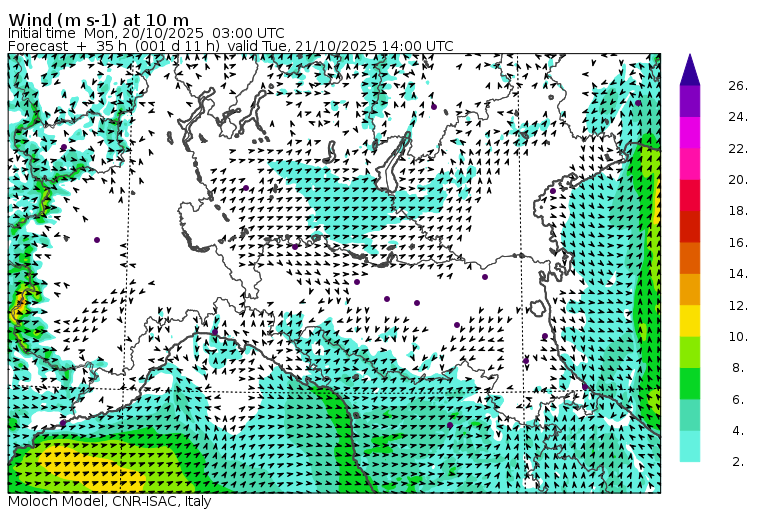
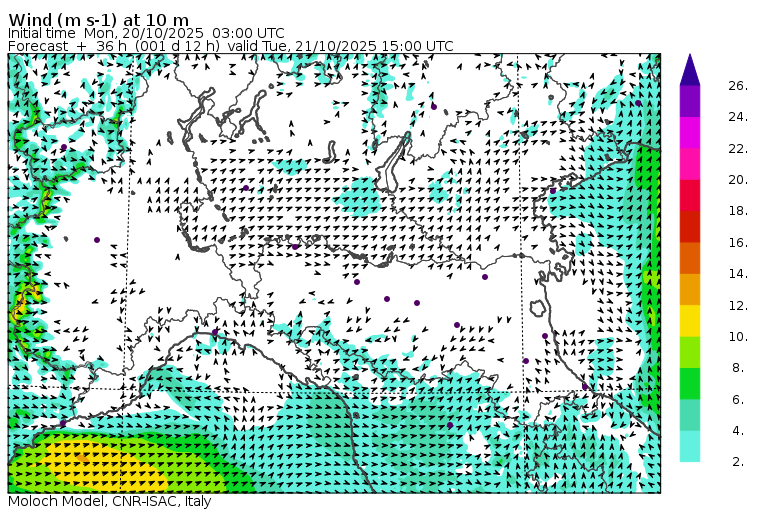
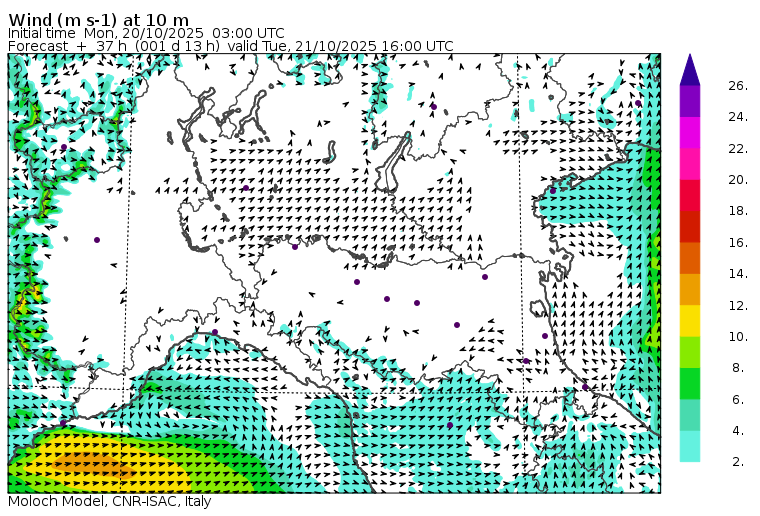
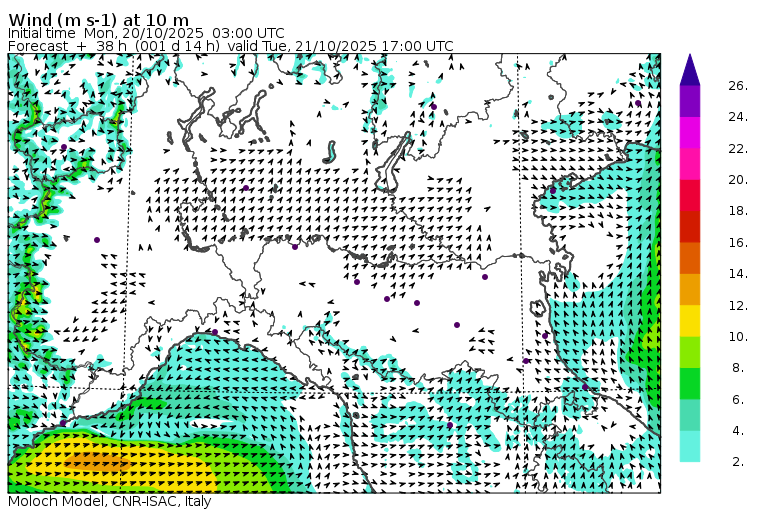
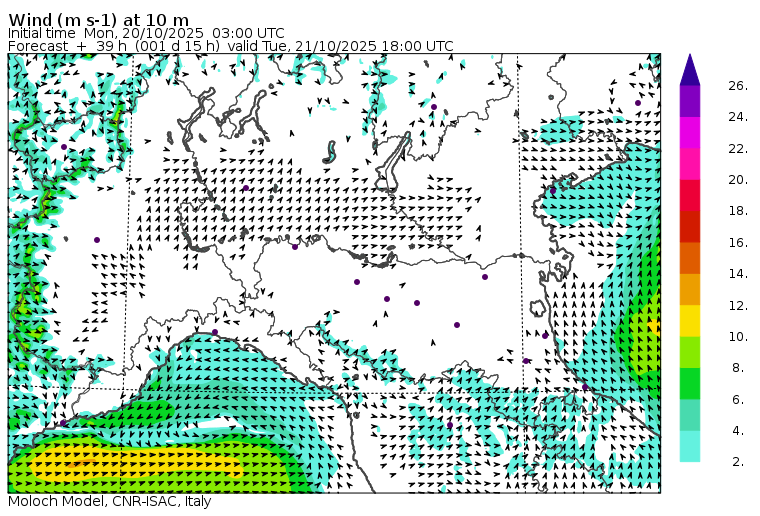
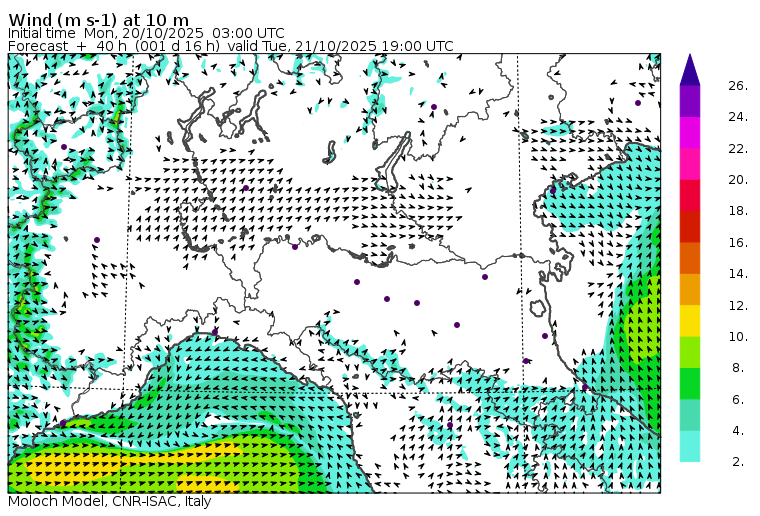
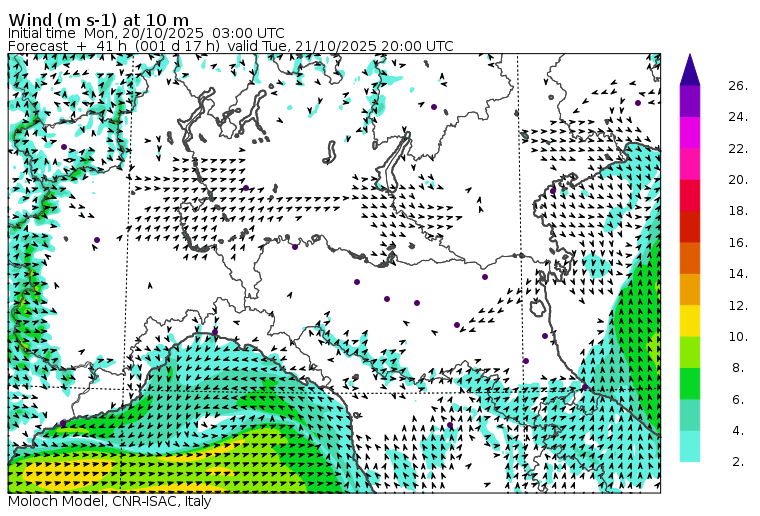
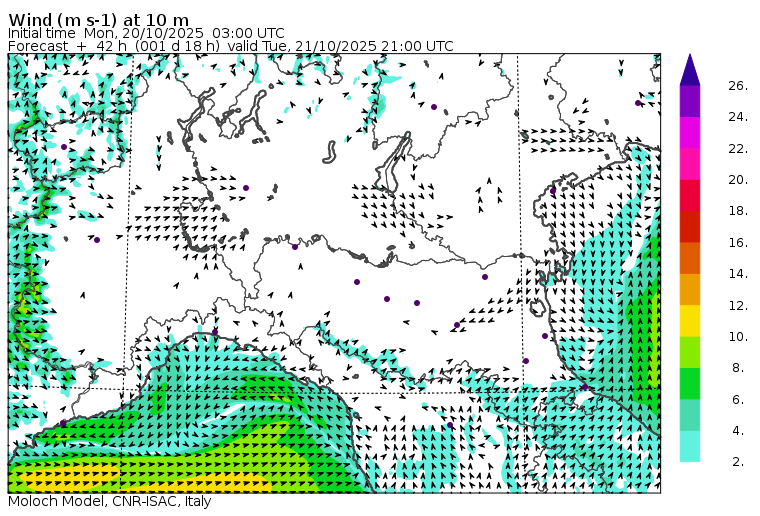
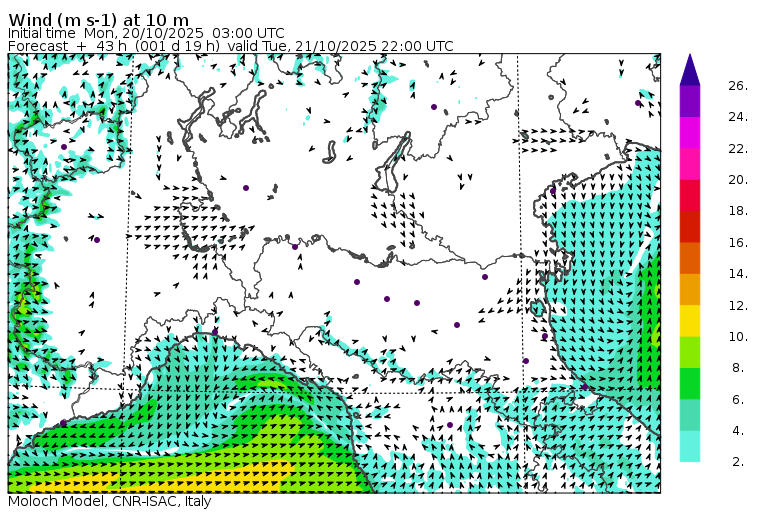
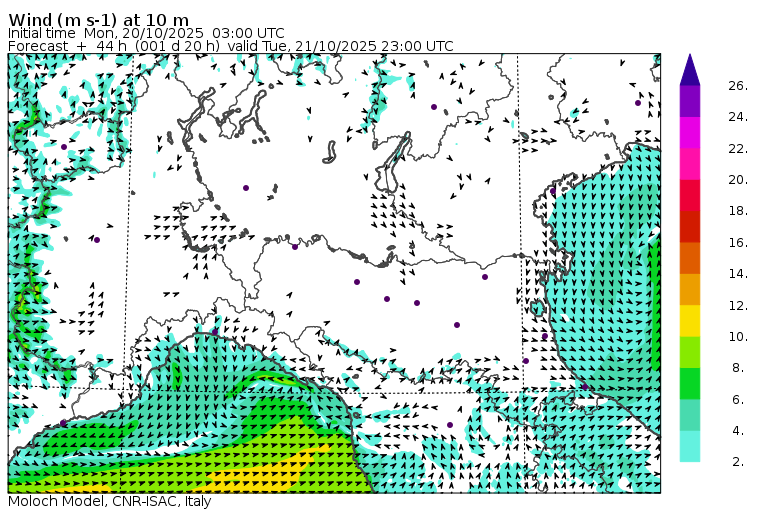
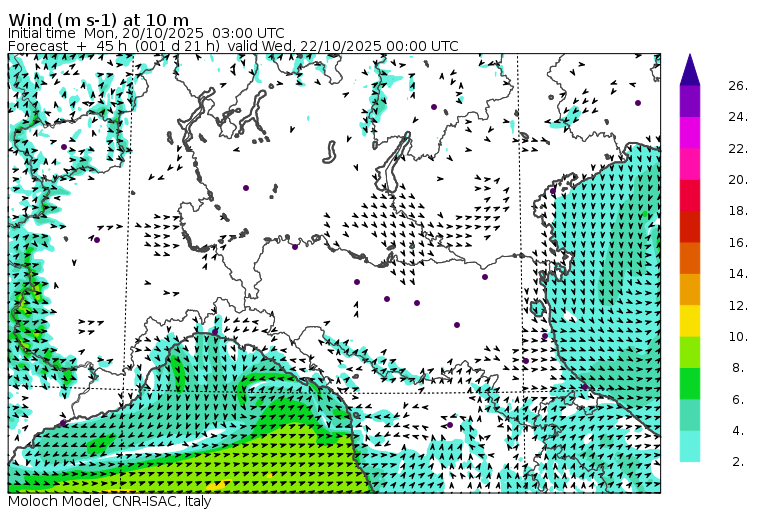
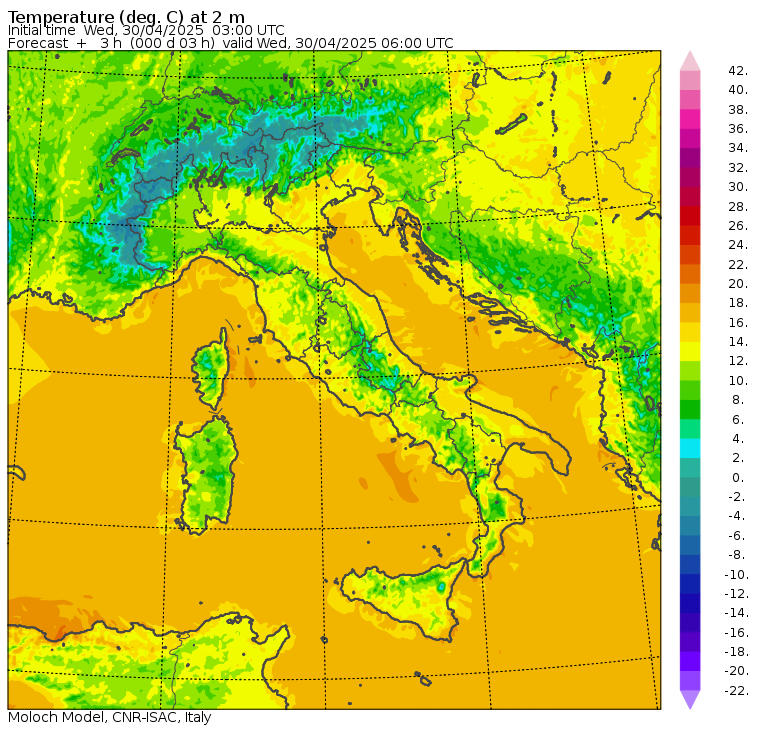
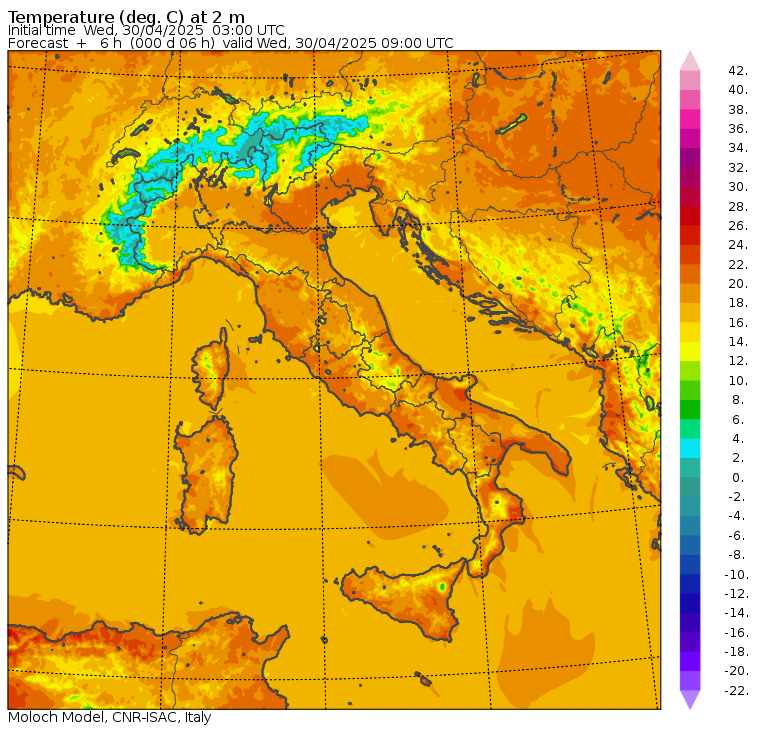
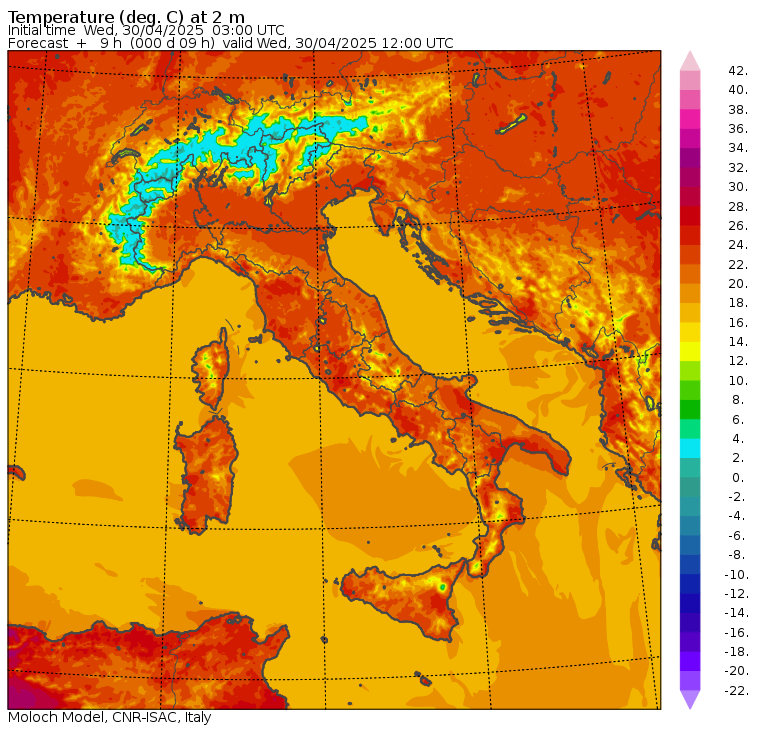
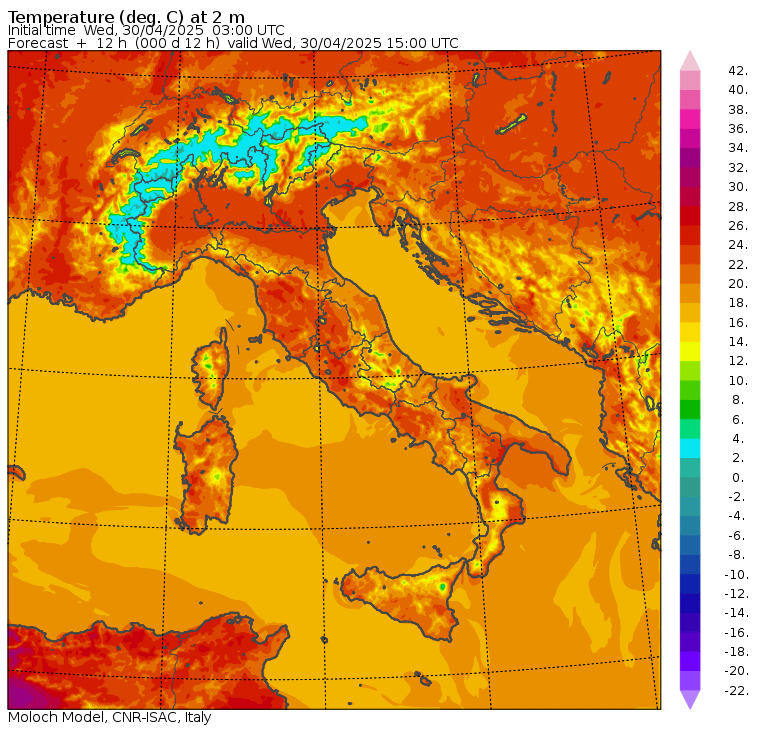
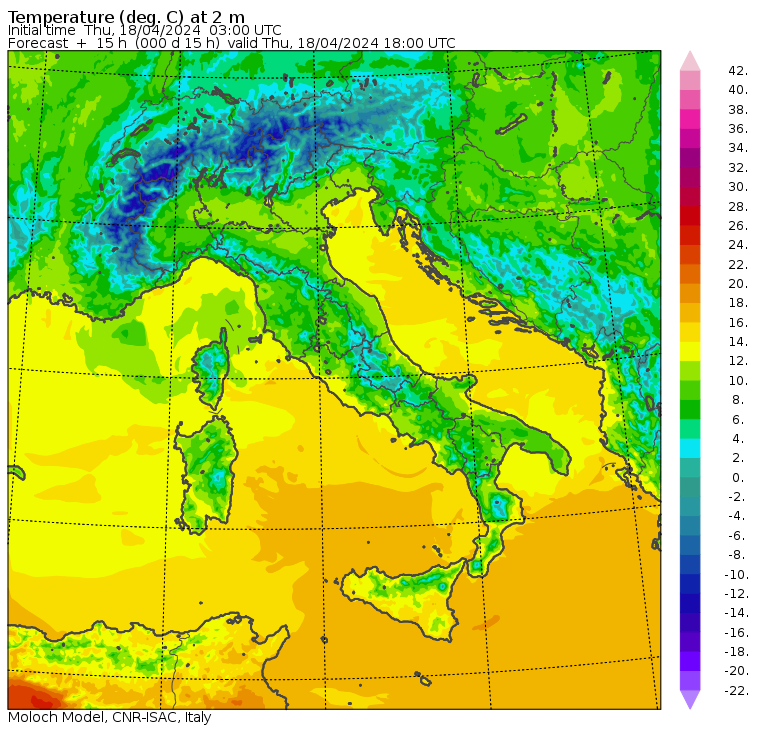
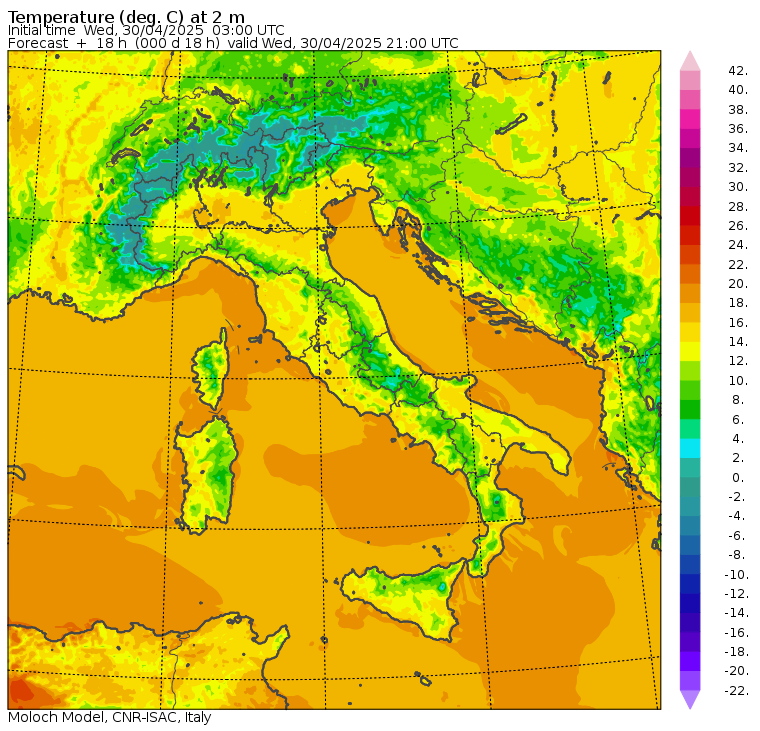
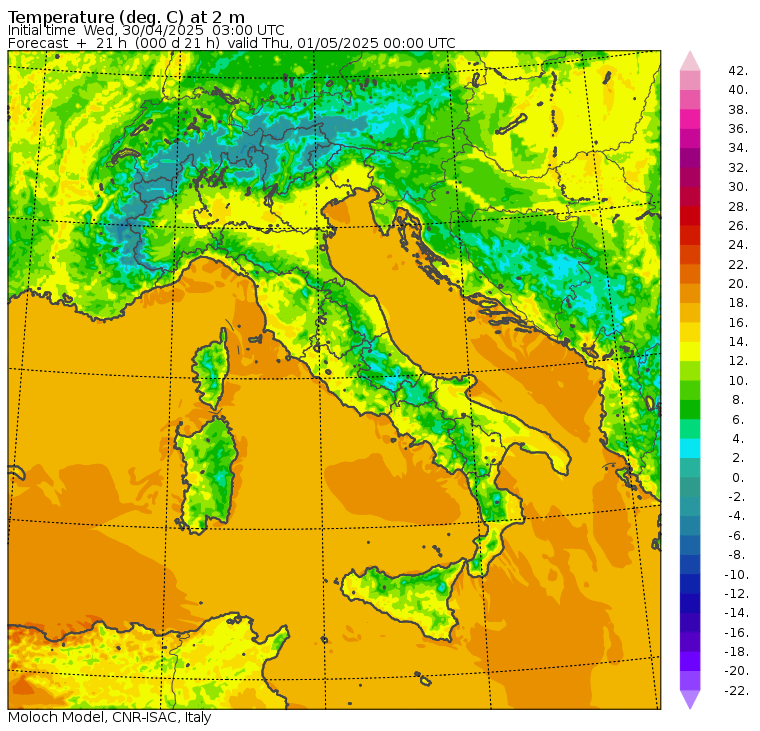
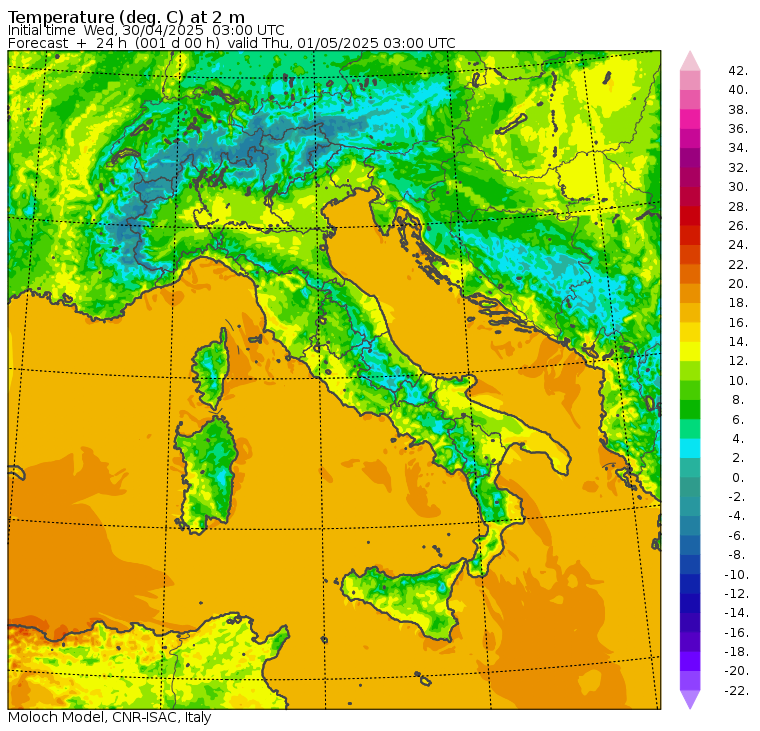
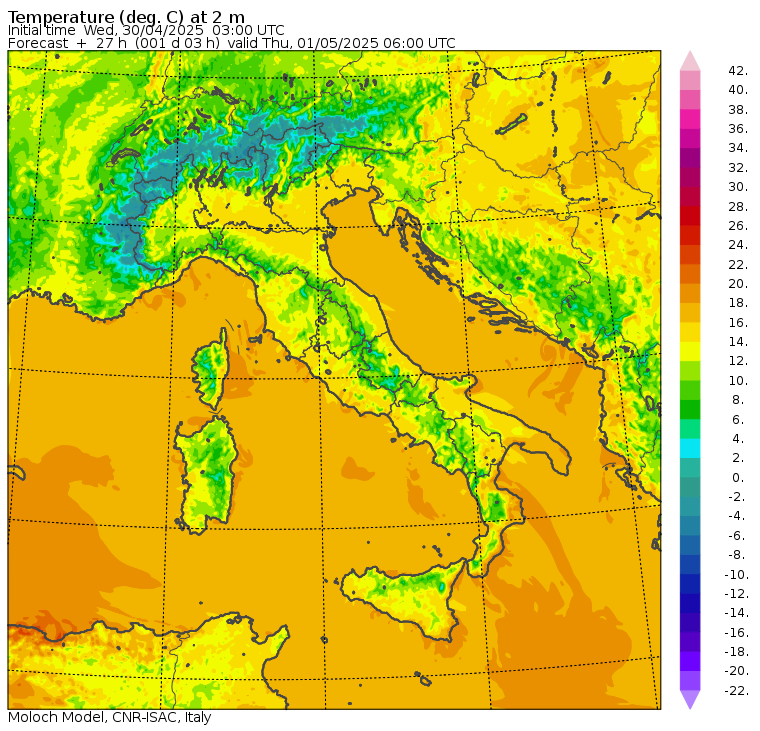
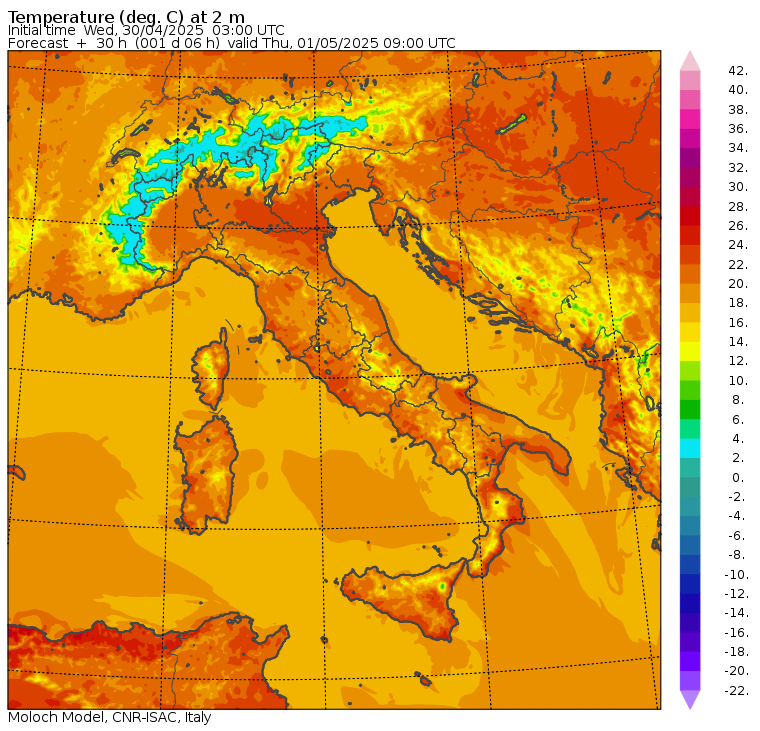
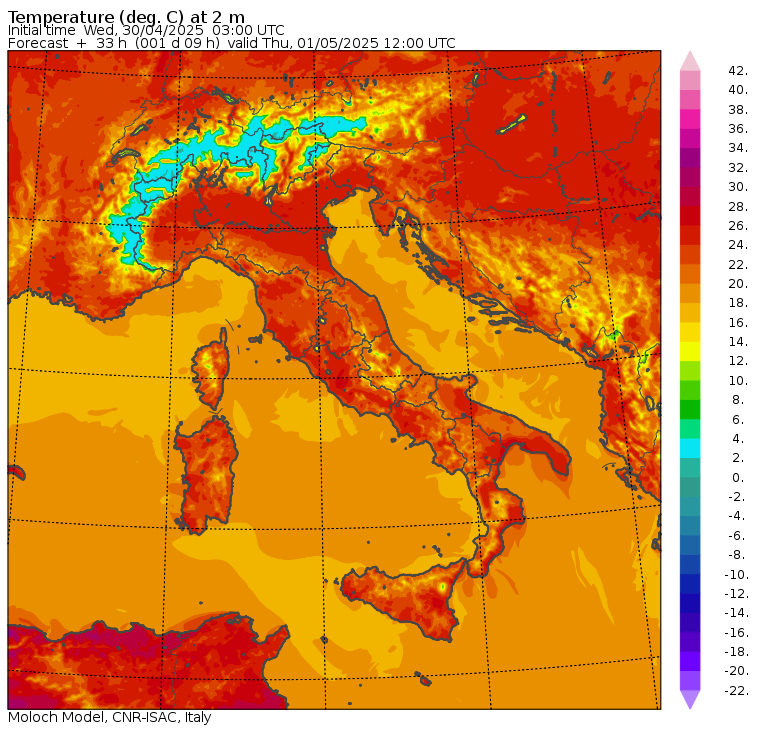
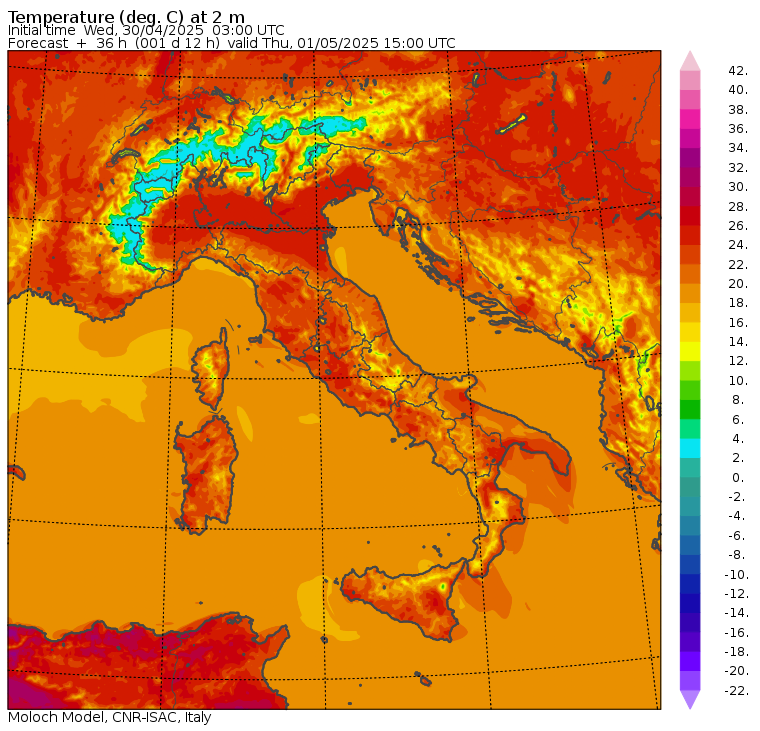
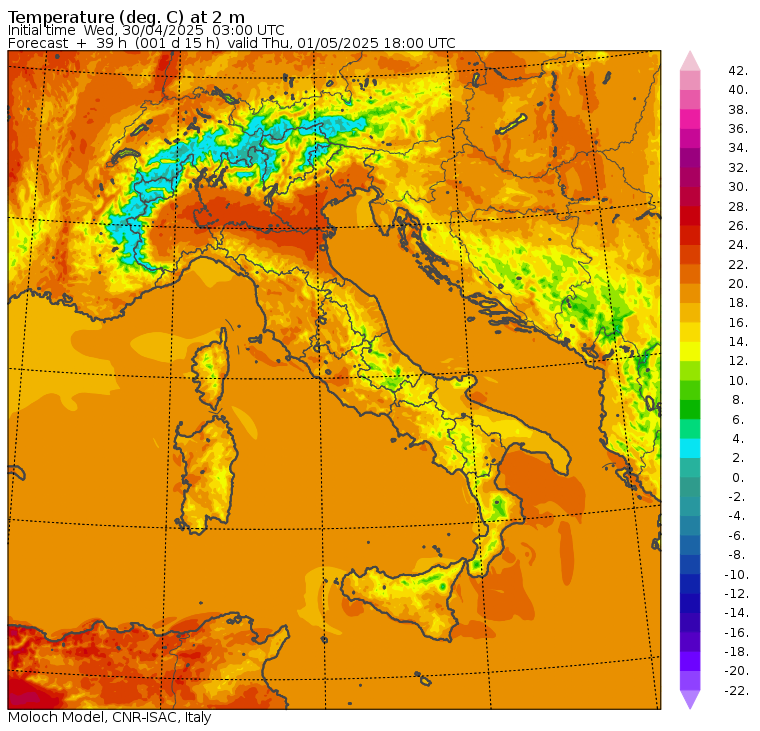
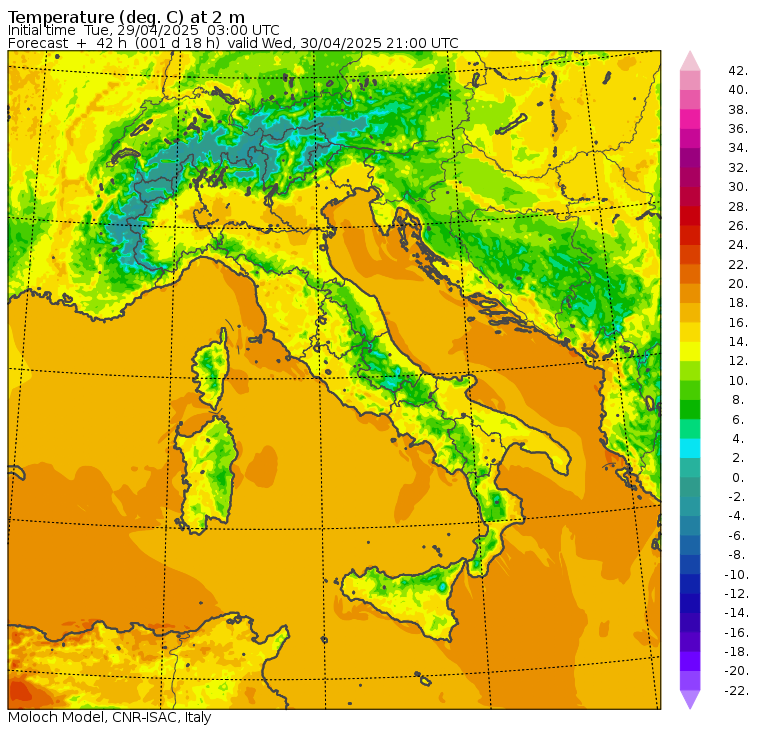
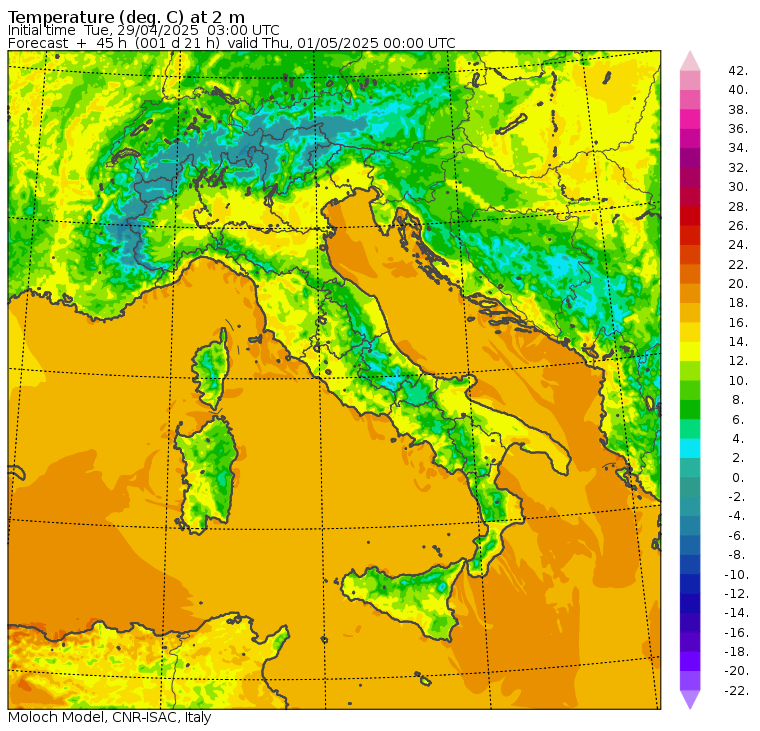
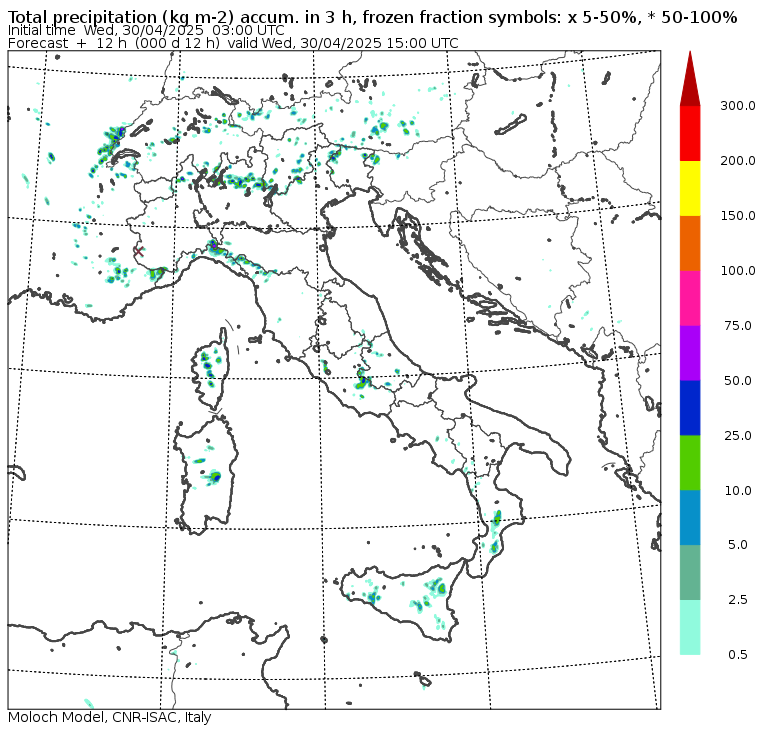
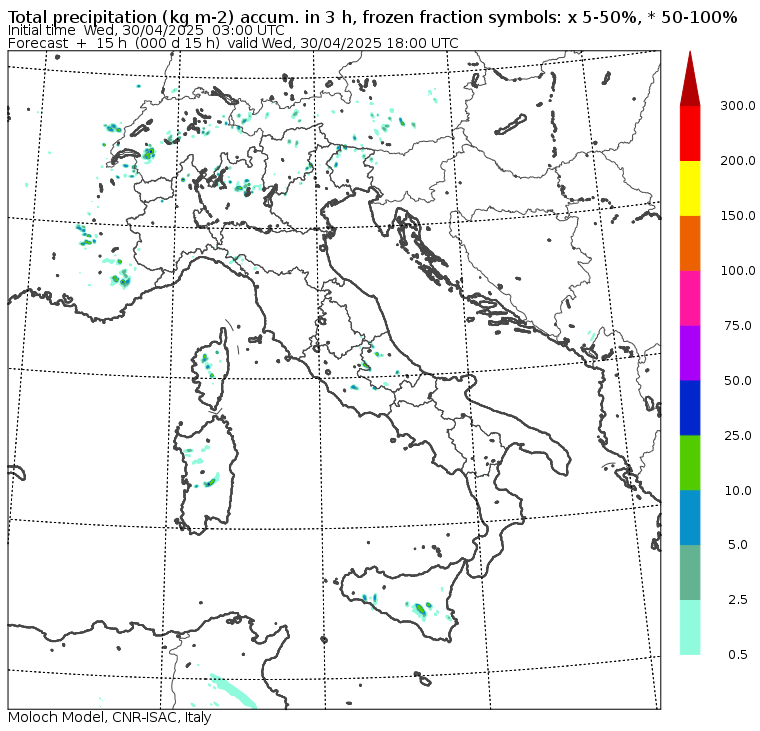
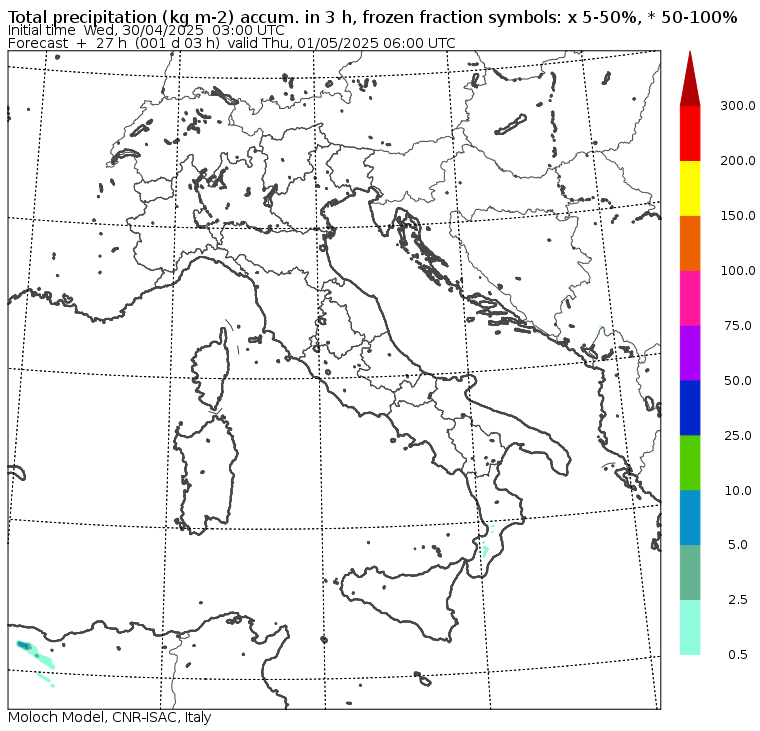
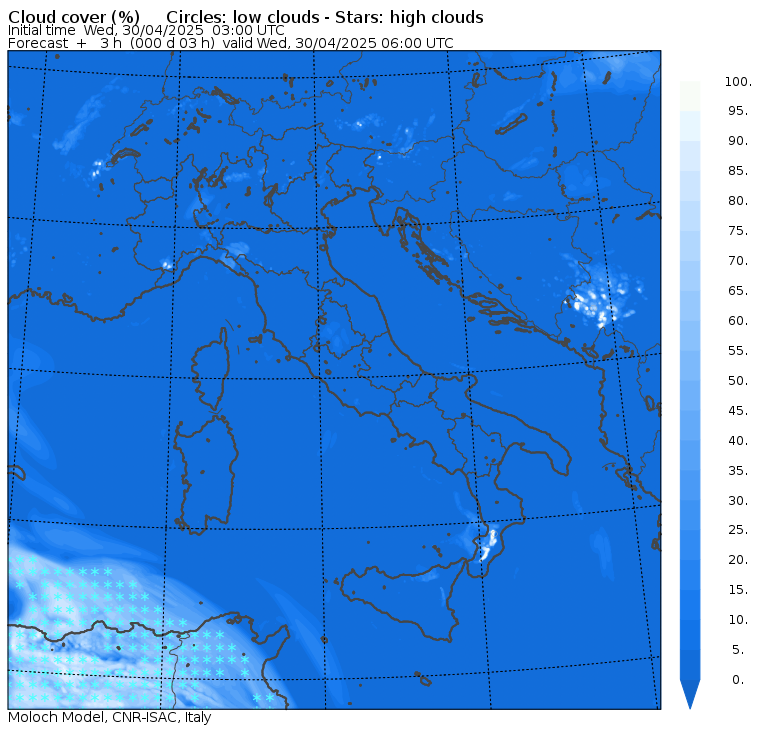
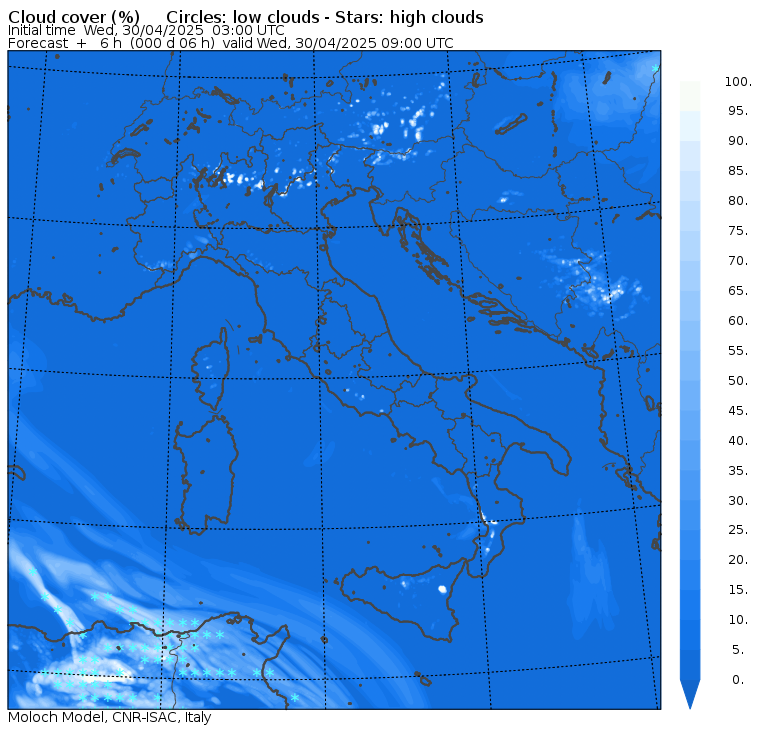
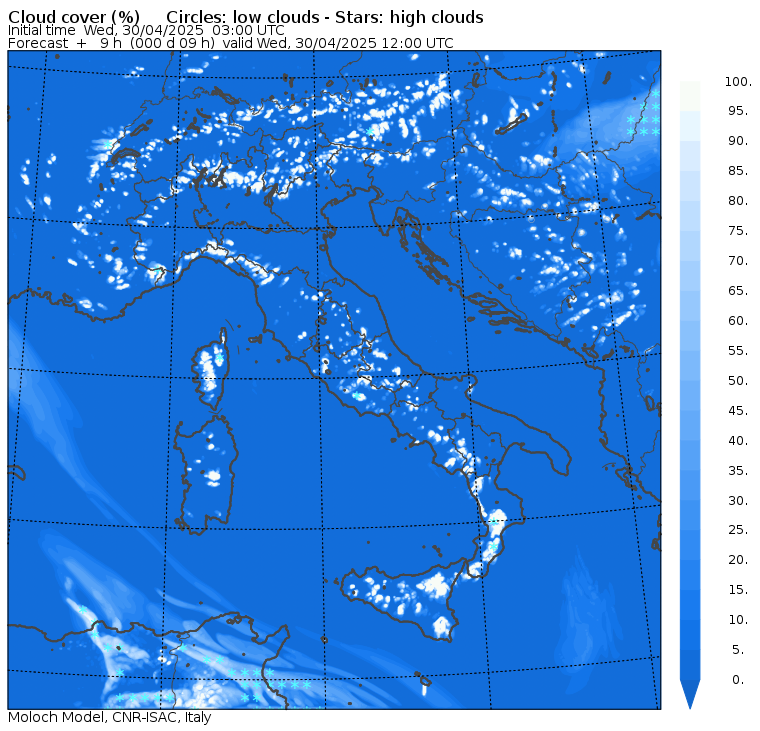
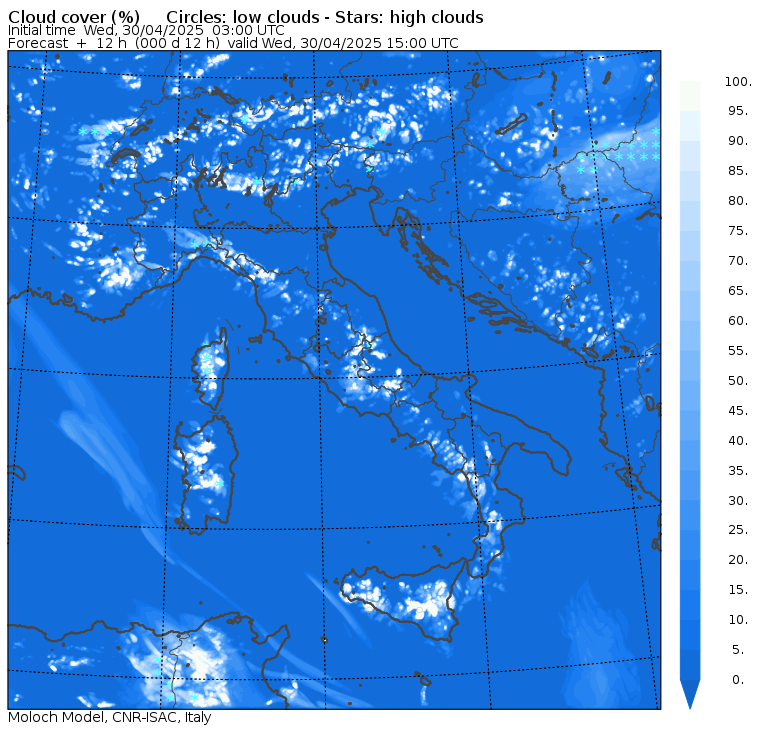
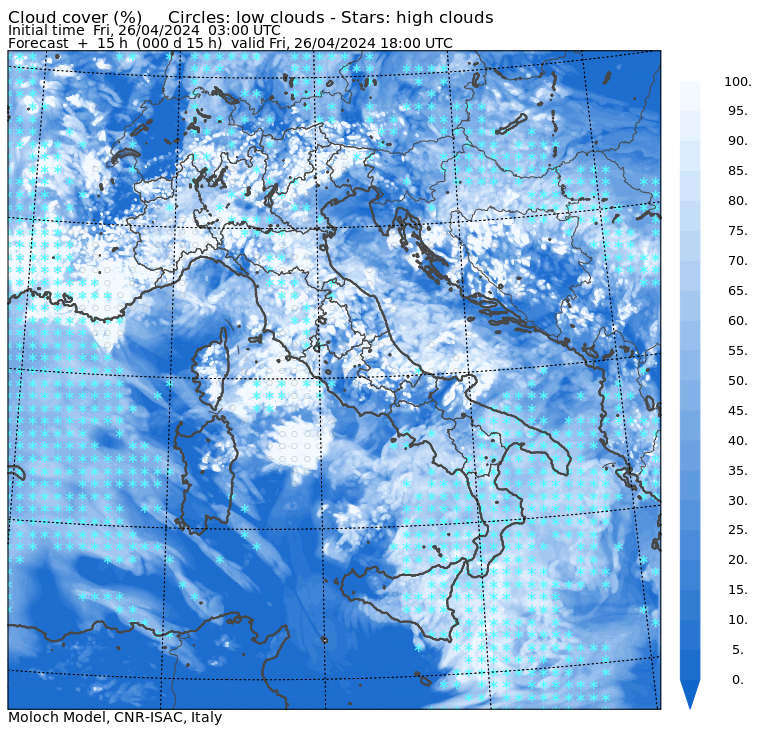
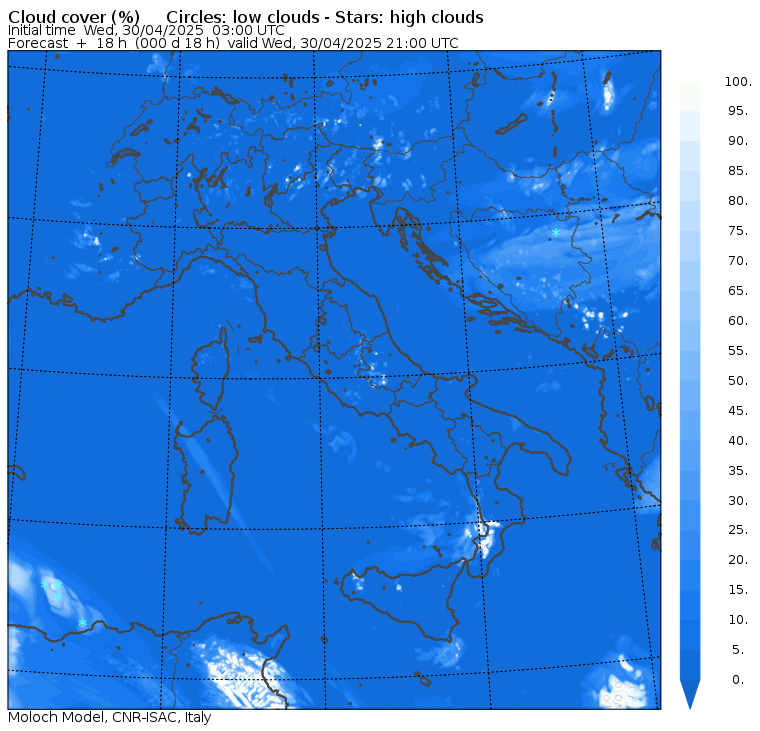
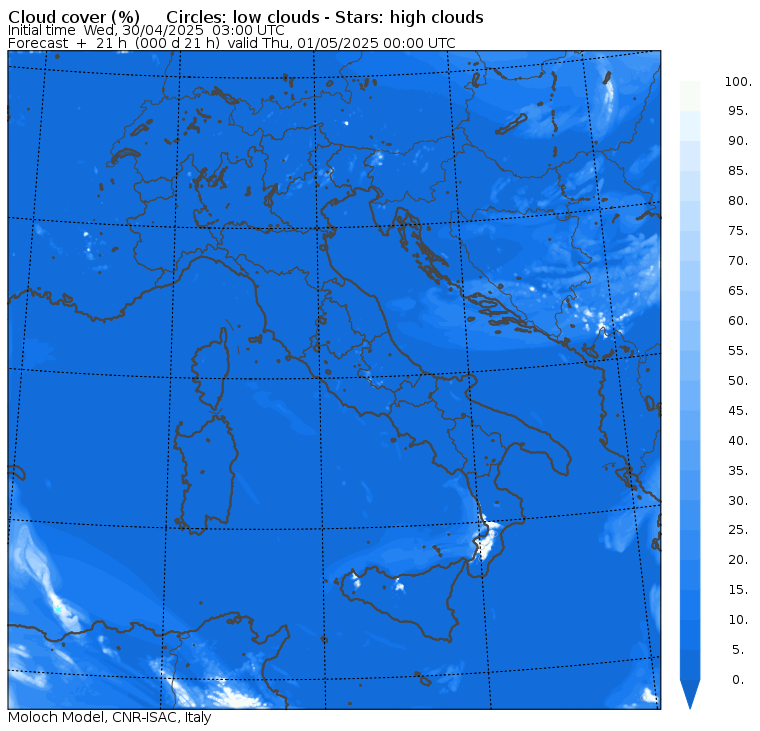
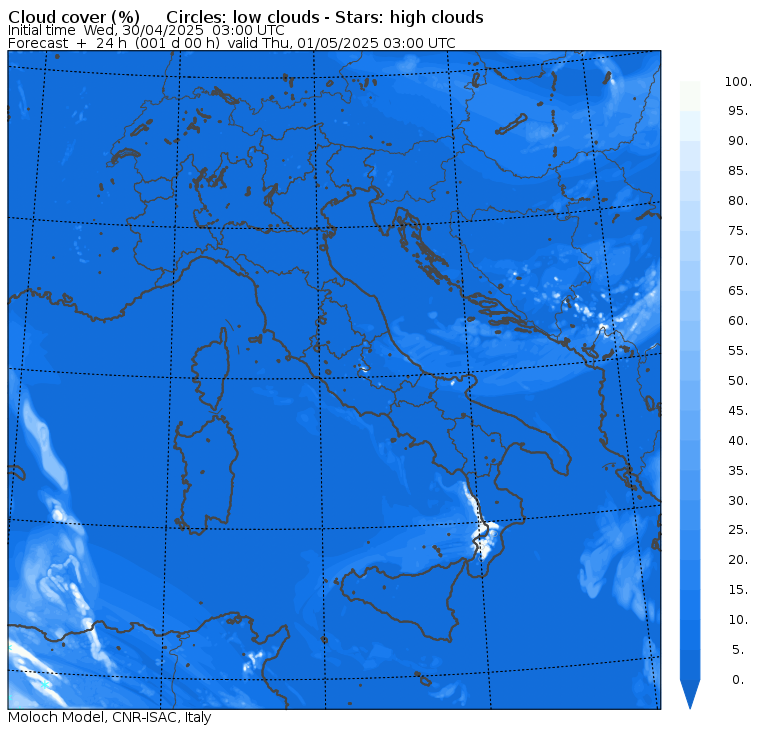
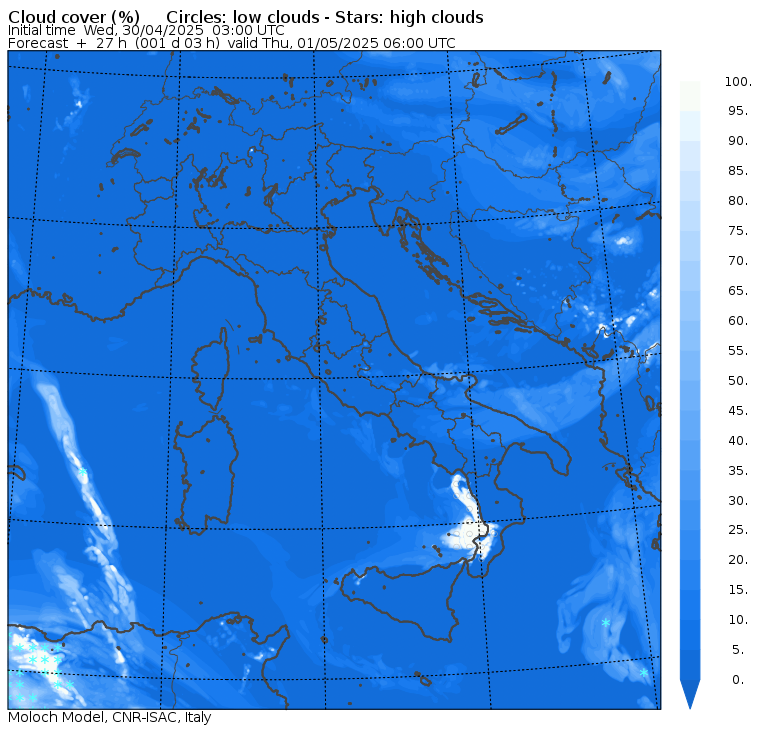
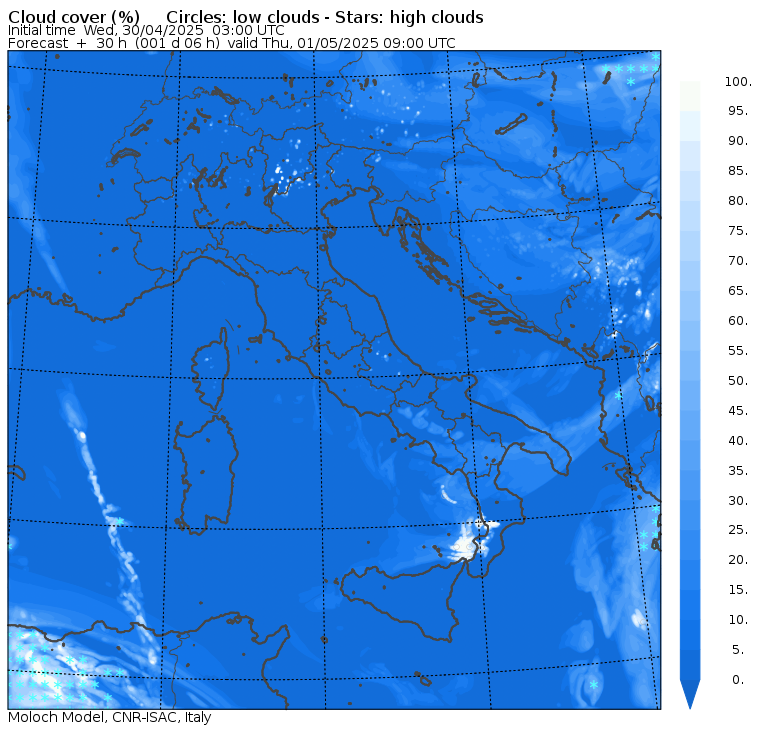
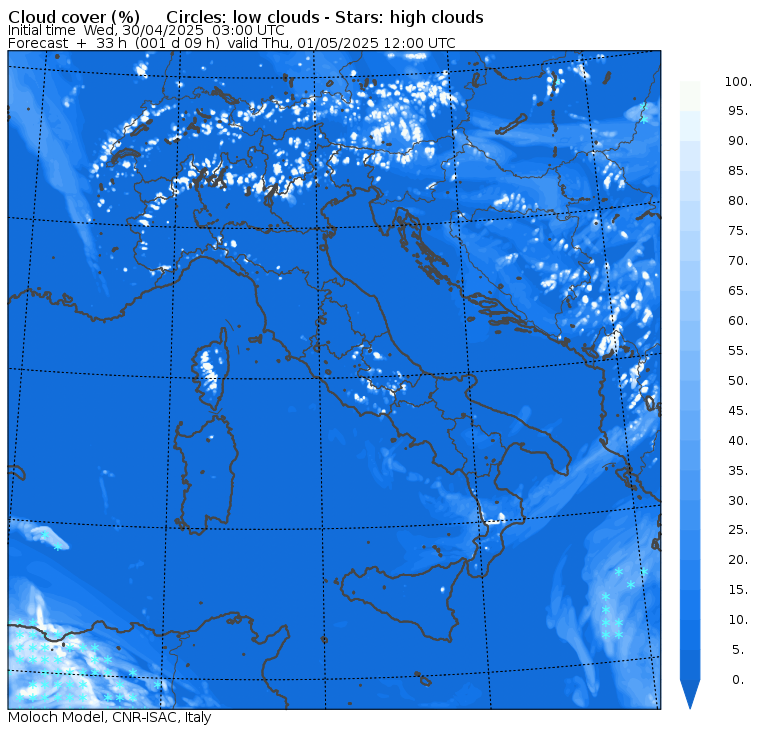
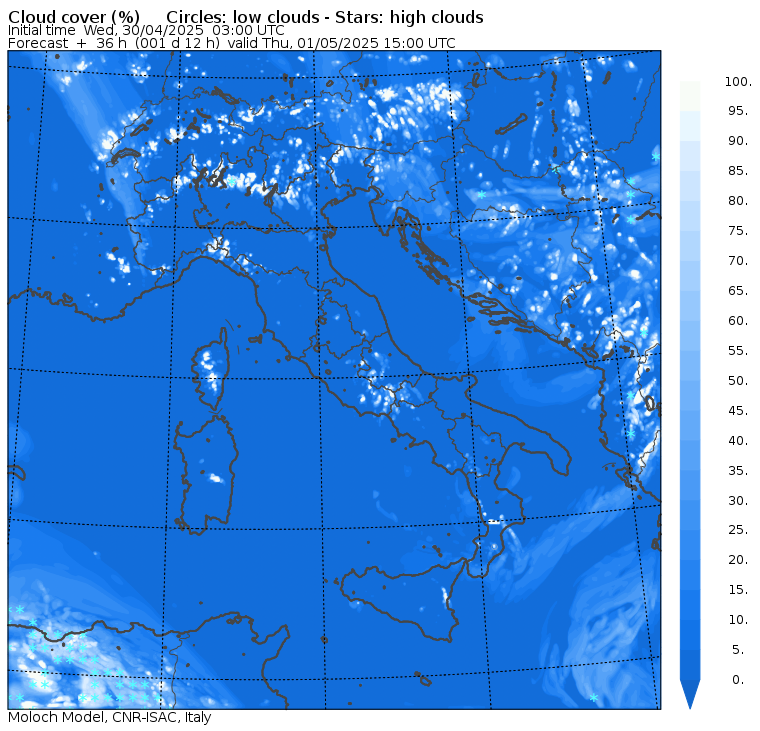
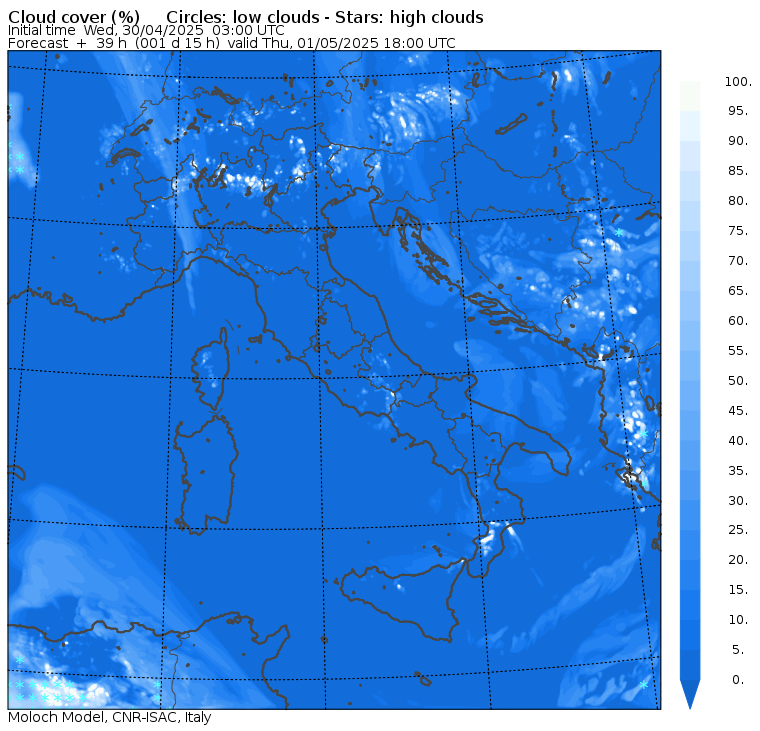
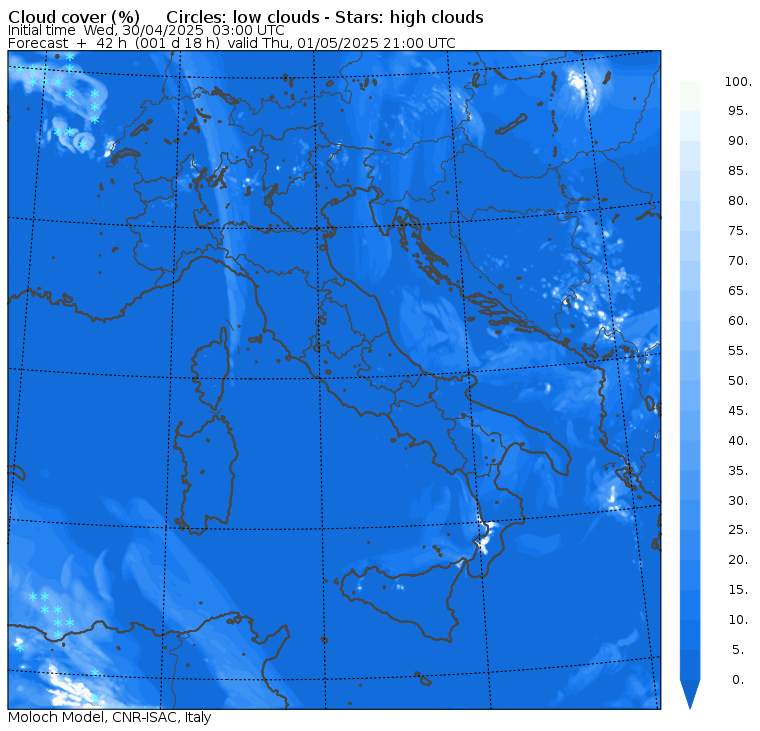
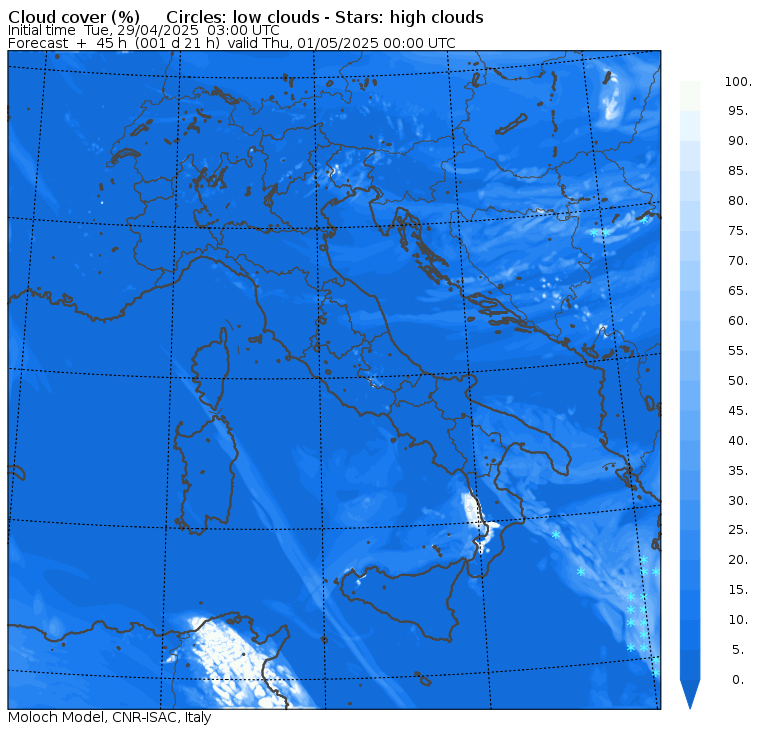
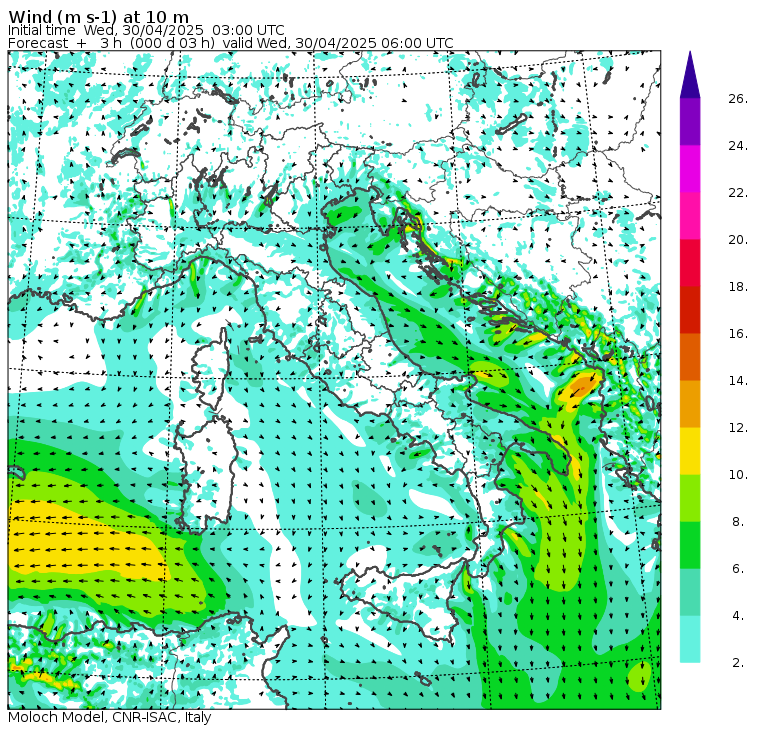
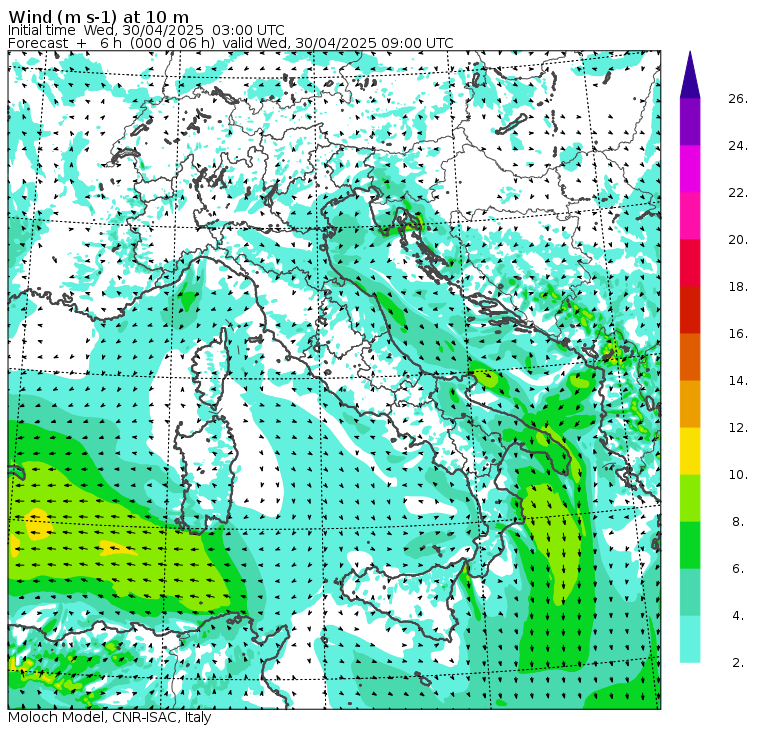
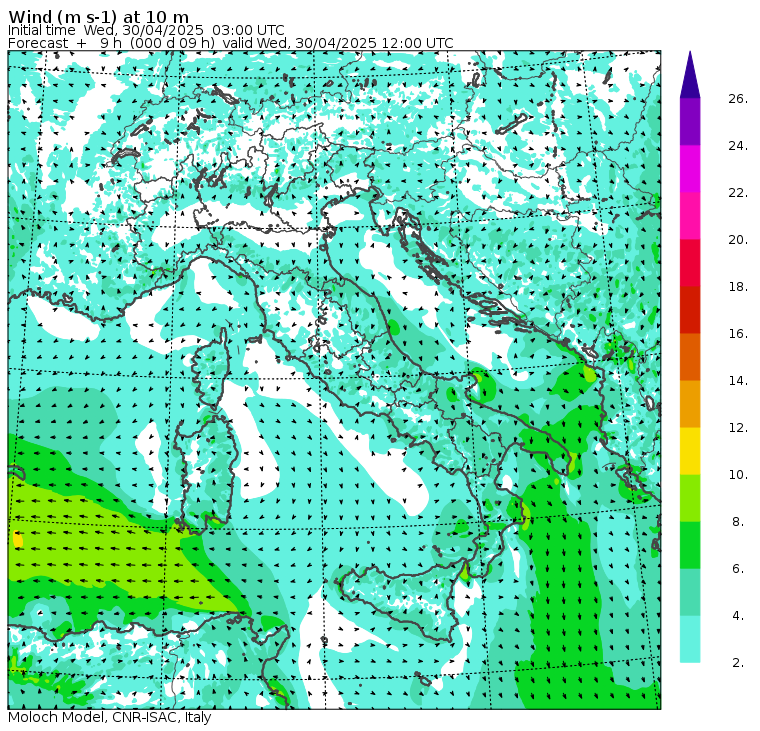
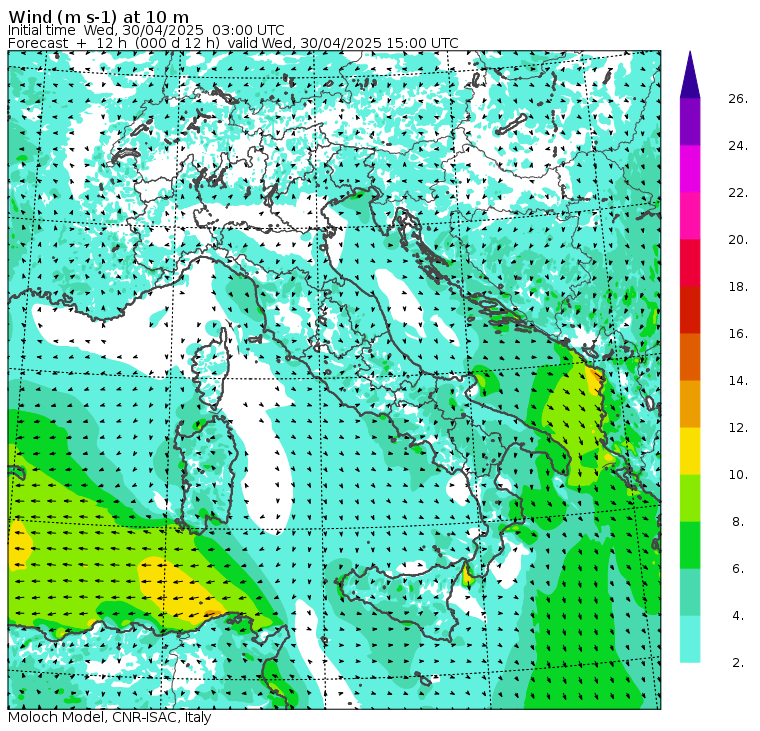
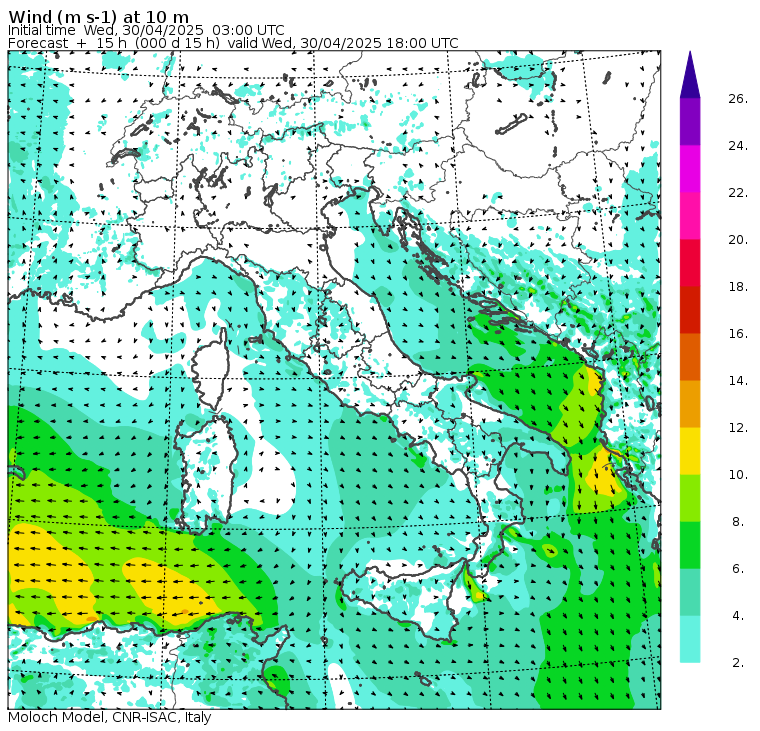
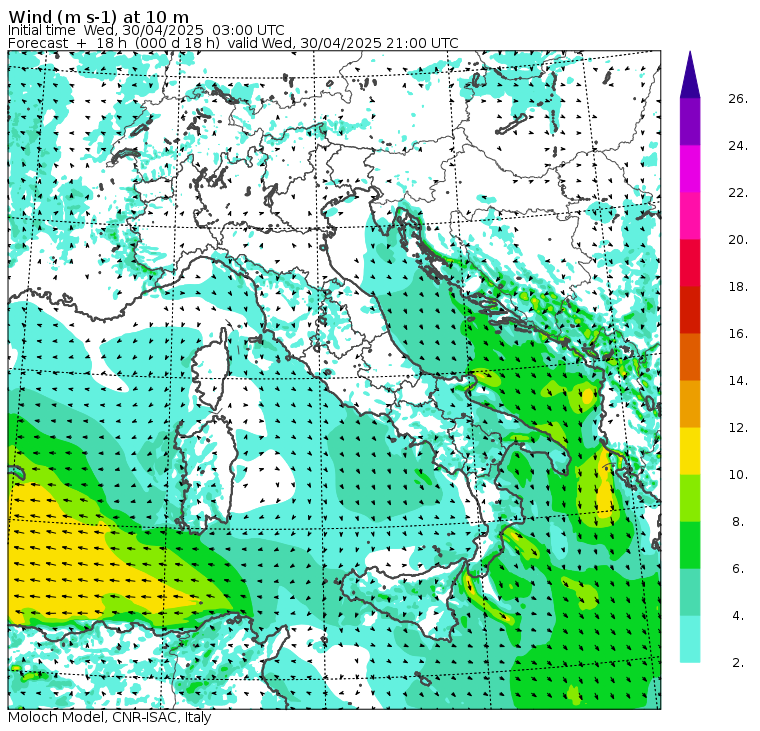
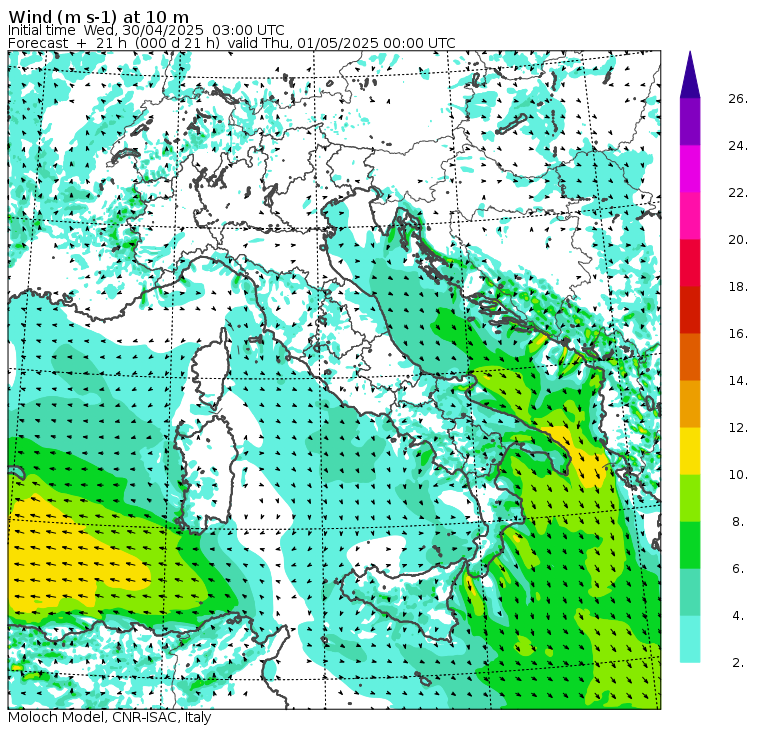
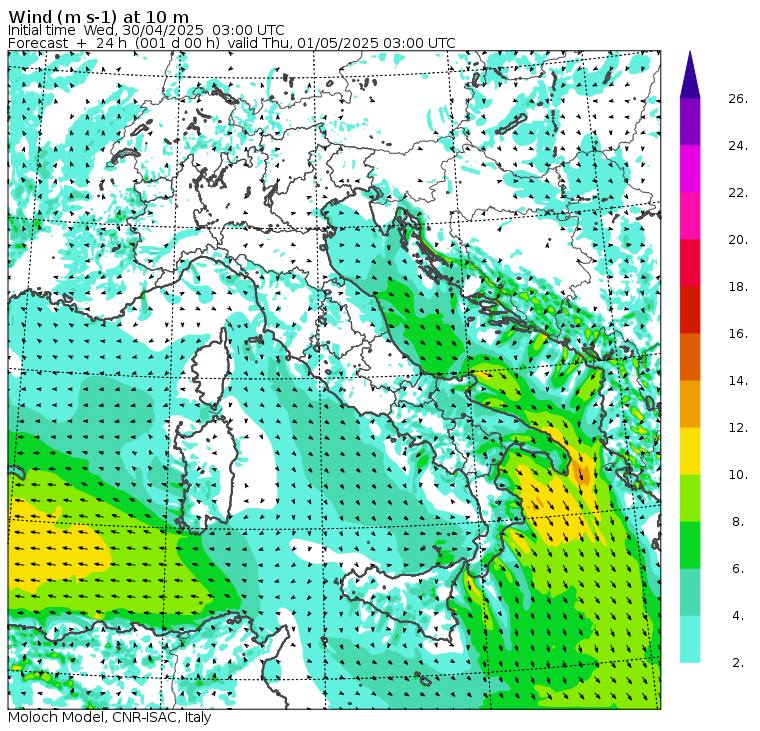
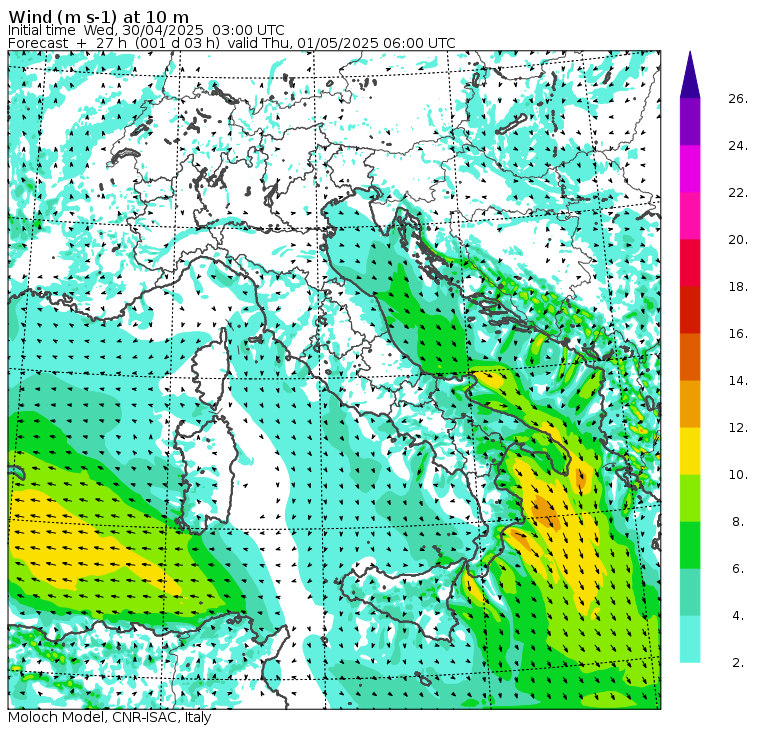
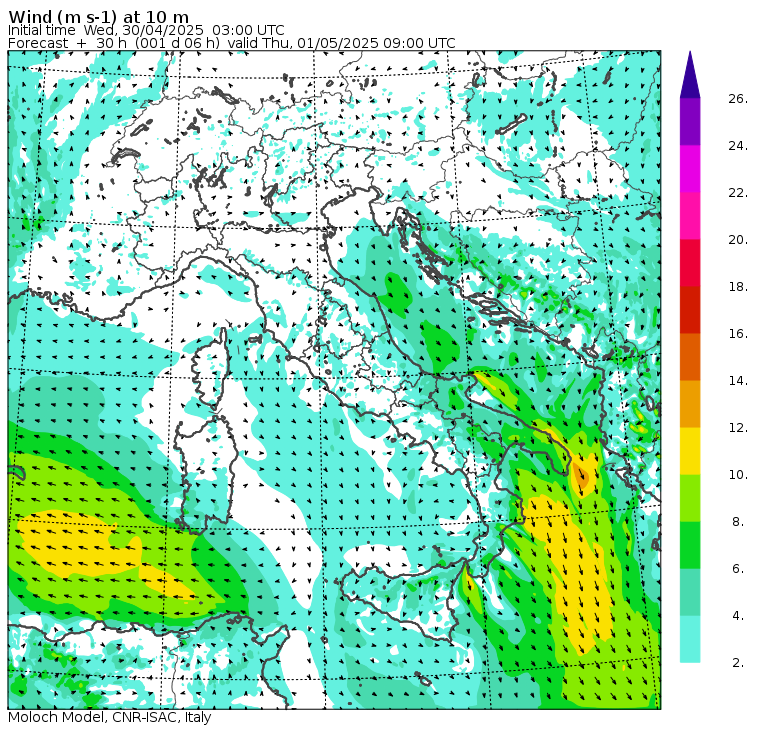
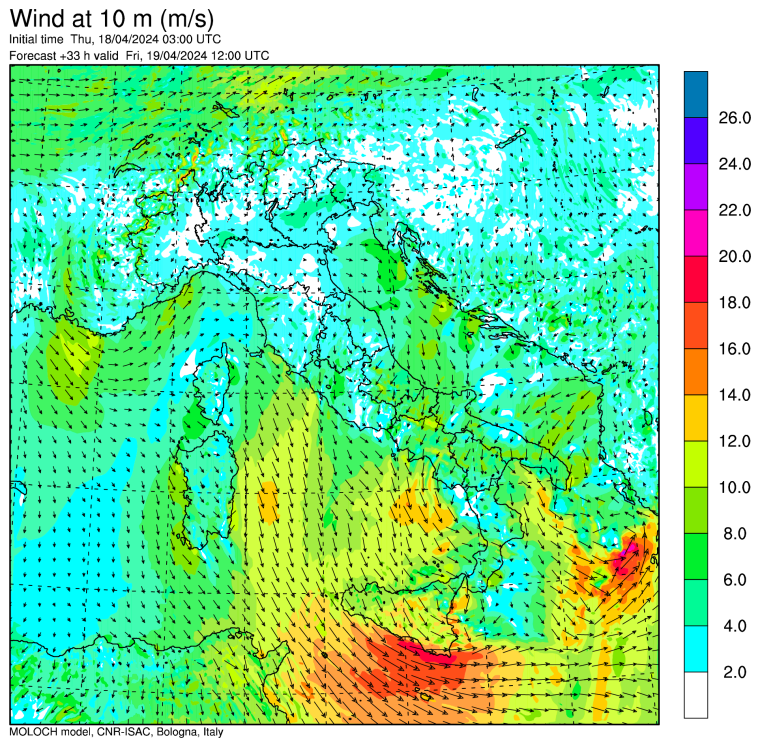
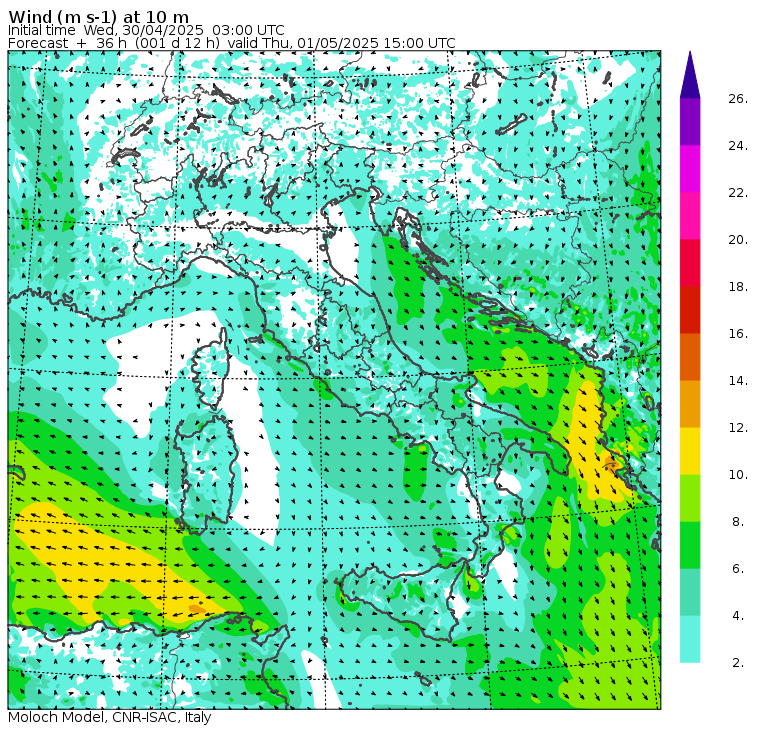
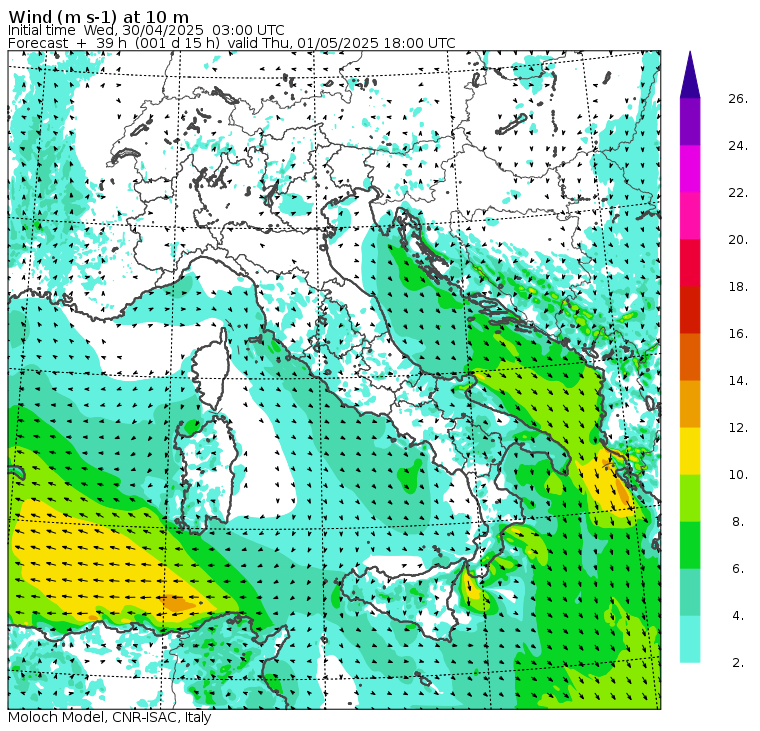
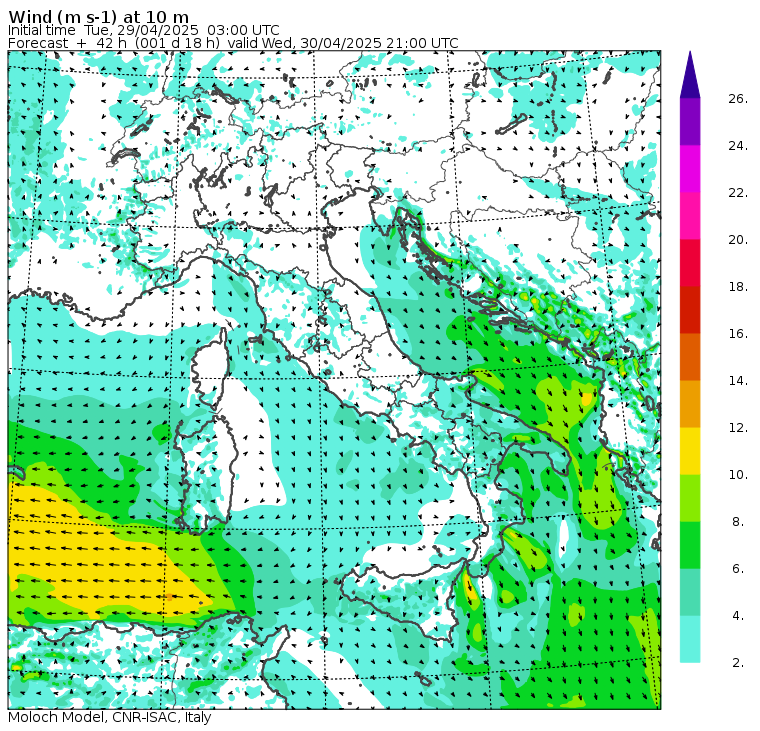
Maps of regional (hourly) and national (every three hours) forecasting for temperature, precipitation (* = snow), cloud cover and wind. For regional maps sea water temperature at some coastal locations is shown.
Temperature | Precipitation | Cloudiness | Wind |
The observed data are acquired by means of a weather station IRDAM WST 7000, installed at 2 m above the lawn, west of the ISAC building.
The numerical predictions with validity of two days are derived from MOLOCH model, developed by CNR-ISAC and used at the horizontal resolution of 1.25 km. The initial and boundary conditions for the predictions are obtained from analysis (00:00 UTC) and forecasts by the GFS model of NOAA-NCEP (Global Forecast System del National Centers for Environmental Prediction - National Oceanic and Atmospheric Administration, USA). More details are available at http://www.isac.cnr.it/dinamica/projects/forecasts/index.html.
For the assessment of the latest monthly/seasonal/annual anomaly within the context of the last two centuries of climate variability see the link http://www.isac.cnr.it/climstor/climate_news.html.
The information and graphics on this site are generated using raw data and not validated. Therefore this information is provided as-is and is not guaranteed in their accuracy and / or completeness. The conclusions derived from the contents of the site are solely of responsibility of the users who have formulated. The CNR is not liable for improper use of the information provided on this website. For info: infometeobologna @ isac.cnr.it
beta version


